Since Java is a platform-independent language, source code is compiled into an intermediate output file known as bytecode, which is stored in a .class file. If a source file has more than one class, each class is compiled into a separate .class file. These .class files can be loaded by any Java Virtual Machine (JVM). This topic describes how to profile such .class files with AQTime.
Preparing an AQTime Project
-
Compile your Java application with debug information (see Compiler Settings for Java Compiler).
-
Launch AQTime and create a new empty AQTime project.
-
Select the
 Normal profiling mode on AQTime’s Standard toolbar.
Select the
 Normal profiling mode on Visual Studio’s AQTime toolbar.
Select the
 Normal profiling mode on RAD Studio’s AQTime Profiling Modes toolbar.
 -
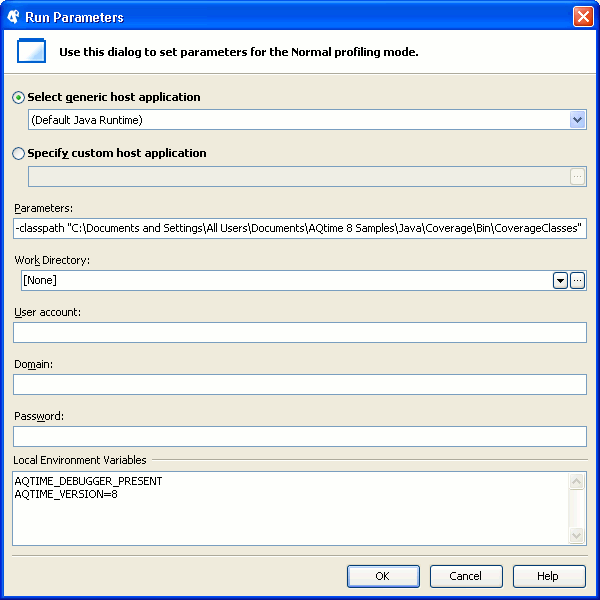
Choose Run > Parameters from AQTime’s main menu.Choose AQTime > Parameters from Visual Studio’s main menu.Choose AQTime > Parameters from RAD Studio’s menu. This will invoke the Run Parameters dialog.
-
Specify the Java application launcher as a host application. You can do this in two ways:
-
Select Default Java Runtime from the Select generic host application drop-down list. In this case, AQTime will use the JVM specified by the Default Java Runtime option.
-- or --
-
Enter the fully-qualified path to the Java launcher file in the Specify custom host application edit box. The file path can be any of the following:
- <JRE>\bin\java.exe
- <JRE>\bin\javaw.exe
- <JDK>\bin\java.exe
- <JDK>\bin\javaw.exe
For more information, see Selecting Target Java Virtual Machine.
-
-
In the Parameters edit box, enter the
-classpathcommand-line argument followed by the path and the name of the class file you want to profile. For example:-classpath "C:\Documents and Settings\All Users\Documents\AQTime 8 Samples\Java\Coverage\Bin\CoverageClasses" CoverageSample.
Note: In order to be executed, a class should have the mainmethod (declared as public and static), which must not return any value and must accept a String array as a parameter.If the path string contains space characters, enclose it in quotation marks. If the class file resides in a folder listed in the CLASSPATH environment variable, then the
classpathargument may be omitted.You can pass any other standard and non-standard command-line parameters of the Java launcher through the Parameters field of the Run Parameters dialog. For a complete list of Java launcher parameters, see the java - the Java application launcher topic of Java Technology Reference that corresponds to the JRE installed on your machine.
-
Click OK to save the changes and close the dialog.
-
Switch to AQTime’s Setup panel and add the class files you want to profile to the AQTime project.
-
Now the project is ready for profiling. If needed, you can enable the Entire Java Code preset area, create custom areas, or tune triggers and actions. Note that if the Entire Java Code area is used, AQTime profiles all the functions executed by the Java Virtual Machine, including those that are added to the excluding areas. In other words, the excluding areas are ignored in such cases.
Profiling Procedure
-
Start profiling in AQTime. AQTime will launch the Java Virtual Machine, which, in turn, will invoke the profiled class file(s).

Profiling Java code by attaching a profiler to a running Java application is currently not supported. -
Perform the desired actions over the application. AQTime will profile it.
-
To generate results, either close the application, or use the Get Results command.
AQTime will display profiling results in its panels.
To denote the profiling results for routines declared within nested classes, the dollar sign is used. For instance:
Collections$UnmodifiableList::indexOf.
See Also
Profiling Java Applications
Profiling Java Applications - Overview
Selecting Target Java Virtual Machine
Profiling Java Archives
Profiling Mixed-code Java Applications

 Preparing an AQTime Project