AQTime can profile Java applications represented in the form of Java archives (.jar) and machine-readable class files (.class). This topic explains how to profile Java archives.
A Java archive (.jar) includes multiple machine-readable Java files (.class), metadata files and resource files. The ZIP compression algorithm is used to compress the files. Software developers generally use .jar files to distribute their Java applications or libraries.
Preparing an AQTime Project
-
Compile your Java application with debug information (see Compiler Settings for Java Compiler).
-
Launch AQTime and create a new empty AQTime project.
-
Select the
 Normal profiling mode on AQTime’s Standard toolbar.
Select the
 Normal profiling mode on Visual Studio’s AQTime toolbar.
Select the
 Normal profiling mode on RAD Studio’s AQTime Profiling Modes toolbar.
 -
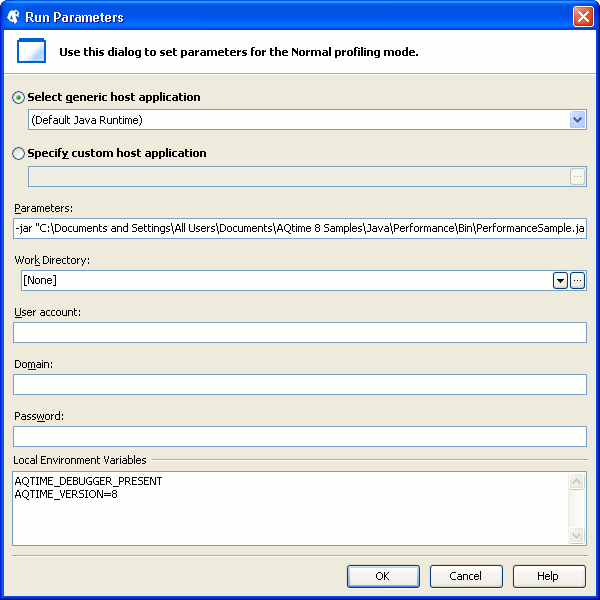
Choose Run > Parameters from AQTime’s main menu.Choose AQTime > Parameters from Visual Studio’s main menu.Choose AQTime > Parameters from RAD Studio’s menu. This will invoke the Run Parameters dialog.
-
Specify the Java application launcher as a host application. You can do this in two ways:
-
Select Default Java Runtime from the Select generic host application drop-down list. In this case, AQTime will use the JVM specified by the Default Java Runtime option.
-- or --
-
Enter the fully-qualified path to the Java launcher file in the Specify custom host application edit box. The file path can be any of the following:
- <JRE>\bin\java.exe
- <JRE>\bin\javaw.exe
- <JDK>\bin\java.exe
- <JDK>\bin\javaw.exe
For more information, see Selecting Target Java Virtual Machine.
-
-
In the Parameters edit box, specify the
-jarargument followed by the fully-qualified path to the Java archive you want to profile. If the path string contains space characters, enclose it in quotation marks.
You can specify any other command-line arguments of the Java launcher in the Parameters edit box. For a complete list of Java launcher parameters, see the java - the Java application launcher topic of Java Technology Reference that corresponds to the version of Java installed on your machine.
-
Click OK to save the changes and close the Run Parameters dialog.
-
Switch to AQTime’s Setup panel and add your Java archive (.jar) to the AQTime project.
-
Now the project is ready for profiling. If needed, you can enable the Entire Java Code preset area, create custom areas, or tune triggers and actions. Note that if the Entire Java Code area is used, AQTime profiles all the functions executed by the Java Virtual Machine, including those that are added to the excluding areas. In other words, the excluding areas are ignored in such cases.
Profiling Procedure
-
Start profiling in AQTime. AQTime will launch the Java Virtual Machine, which, in turn, will call your application or library.

Profiling Java code by attaching a profiler to a running Java application is currently not supported. -
Perform the desired actions over the application. AQTime will profile it.
-
To generate results, either close the application, or use the Get Results command.
AQTime will display the profiling results in its panels.
To denote the profiling results for routines declared within nested classes, the dollar sign is used. For instance:
Collections$UnmodifiableList::indexOf.
See Also
Profiling Java Applications
Profiling Java Applications - Overview
Selecting Target Java Virtual Machine
Profiling Java Classes
Profiling Mixed-code Java Applications

 Preparing an AQTime Project