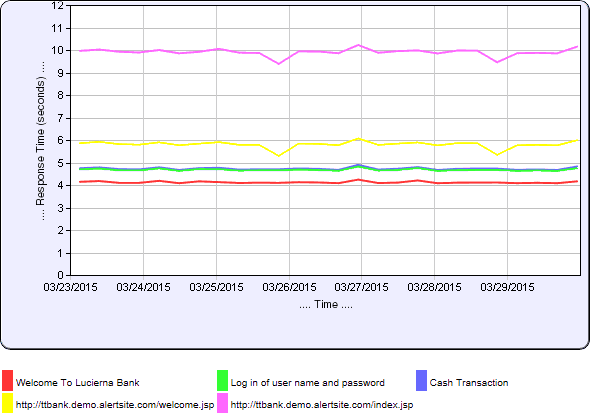
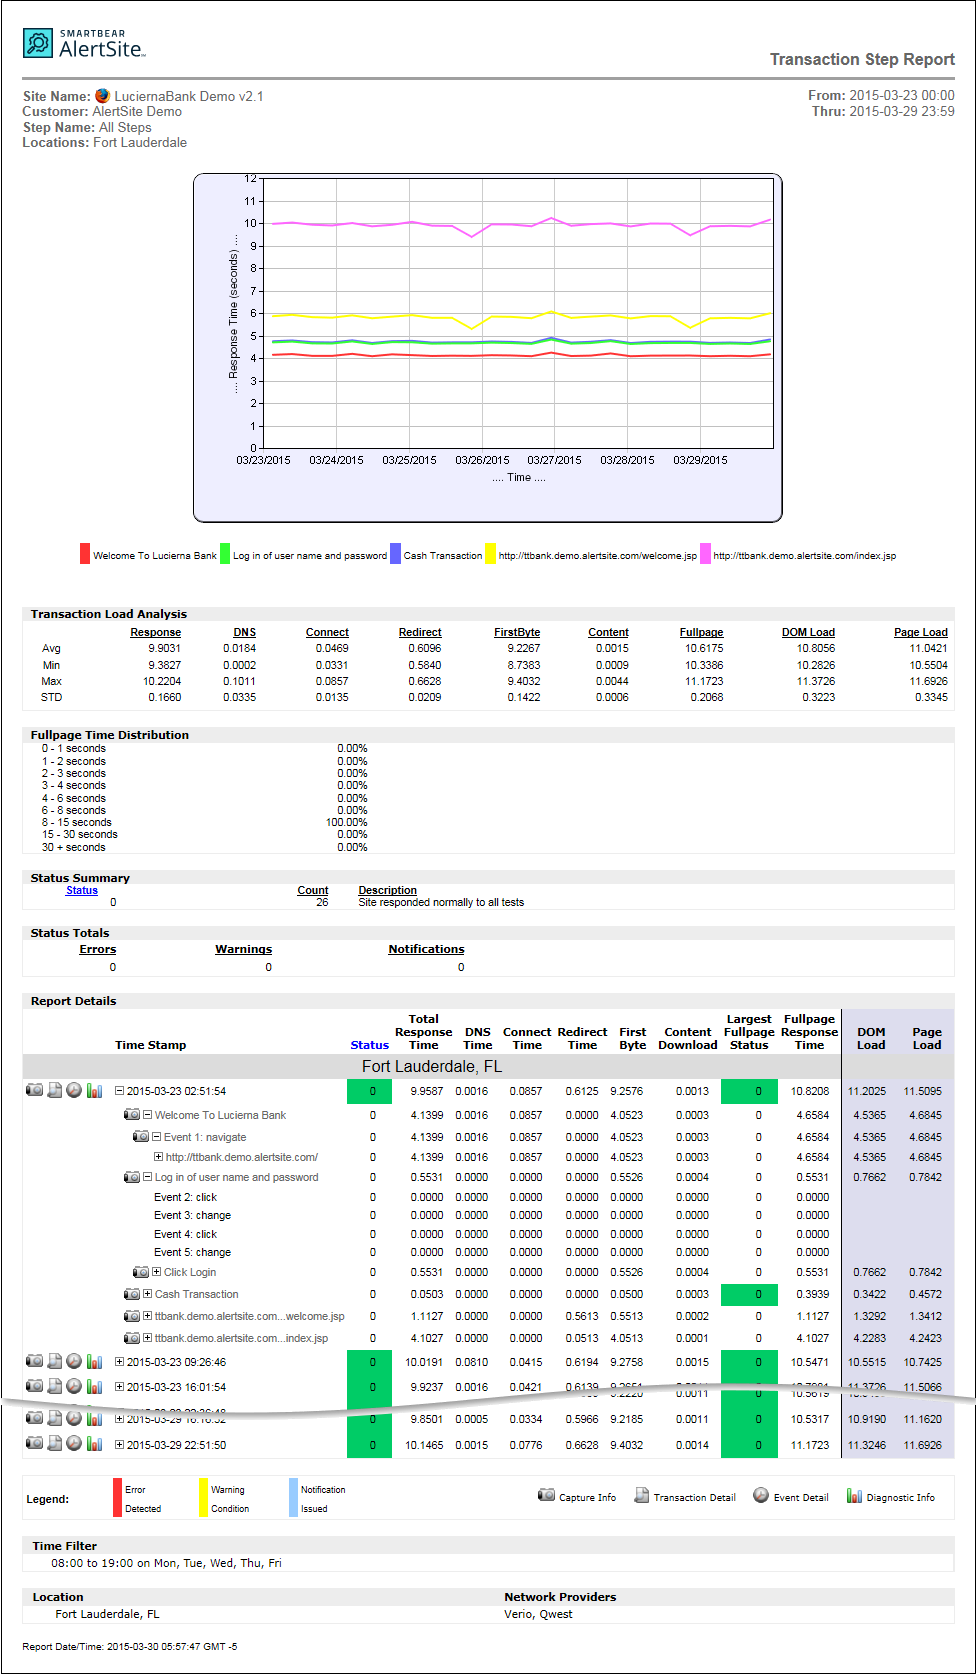
This report is for DéjàClick and API monitors. It shows the response time for one or all steps of the transaction.
Report options
You can customize the report contents using these options:
-
Graphs – A graph that shows the response time of the selected or all steps in the transaction.
-
Transaction Load Analysis – The average, minimum, and maximum response times for either the selected step or the transaction as a whole.
-
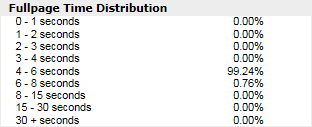
Fullpage Time Distribution – Only for DéjàClick monitors with the fullpage monitoring. Shows the distribution of full page response time values.
-
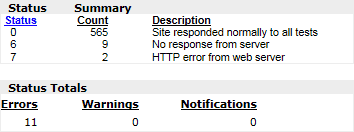
Status Summary – How many times each monitor status code was received, how many errors and warnings occurred, and alerts sent.
-
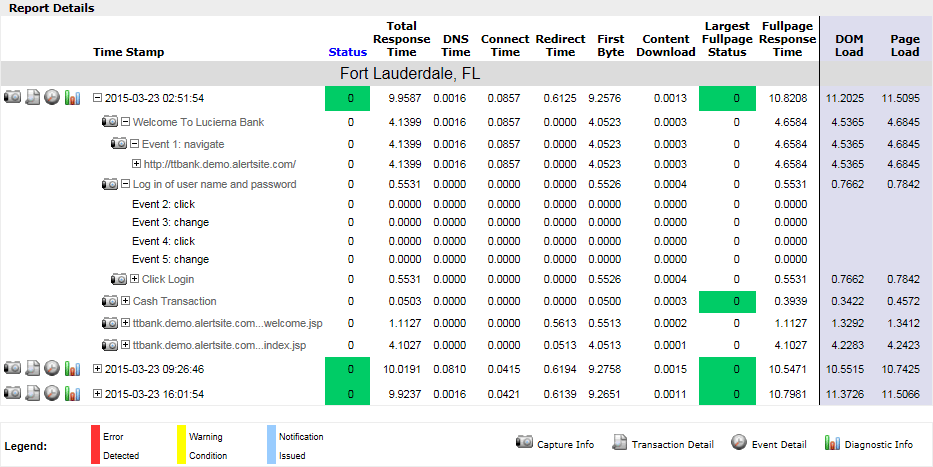
Report Details – A table with all monitor runs over the report period, run statuses, and response times.
In reports created for All steps, you can expand the runs to view results for individual test steps. You can also drill down into details by clicking the icons next to the runs.
Report columns
For a description of the report columns, see Report Column Descriptions.

 View image