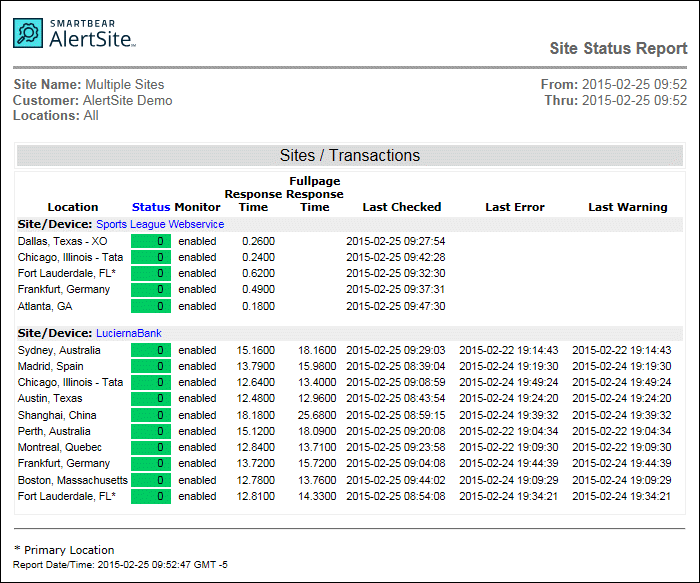
This report shows the current status of the selected monitors and every location they use:
-
The latest status code (0 = success).
-
Website response time during the last check.
-
Date and time the site was last checked.
-
Date and time of the last error and warning.

Report columns
For a description of the report columns, see Report Column Descriptions.
API
You can get the monitor status data in the XML and JSON formats by using AlertSite APIs (the Report API and Management API, respectively).
XML report
The following URL returns all monitor statuses for account C12345 as XML:
https://www.alertsite.com/report-api/sitestatus/C12345
You can open this link in the browser, and the XML report data will be displayed. Make sure to replace the customer ID with yours.
To download the report using cURL or similar tools, include your AlertSite login and password for authentication:
curl -o report.xml -u [email protected]:password https://www.alertsite.com/report-api/sitestatus/C12345
For more information and parameters, see Site Status Report (API).
JSON report
To get monitor status data as JSON, use the GET /report-sitestatus operation of AlertSite Management API. For example:
curl https://api.alertsite.com/api/v3/report-sitestatus -H "Authorization: Bearer ACCESS_TOKEN" -o report.json
You can filter the returned data by monitor type, status (OK/error), and other parameters. For more information, see Get Site Status Report.
