You can filter the AlertSite UXM Dashboard to show only the monitors and monitor groups you are interested in. For example, you can see only monitors in error, or only monitors with a specific name prefix. Use the Open Filter Options button on the toolbar or the blue Add Filter button to open the filter options or choose which type of data you want to view. Find more information about that below.
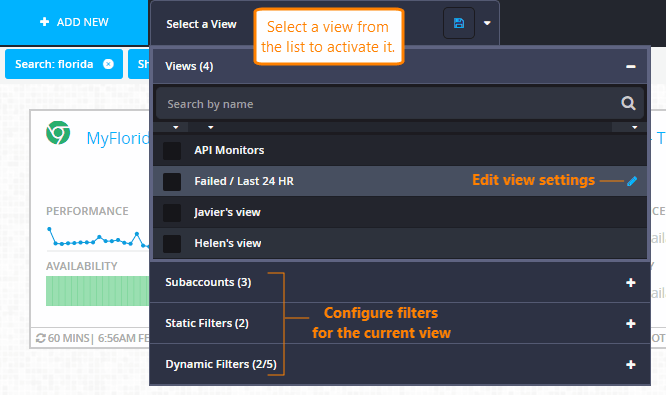
Filters can be saved as custom views for later use. Views are shared among all users in your AlertSite account, and are listed under the Select a View menu at the top of the dashboard. You can quickly switch between them and set a default view.
Default view
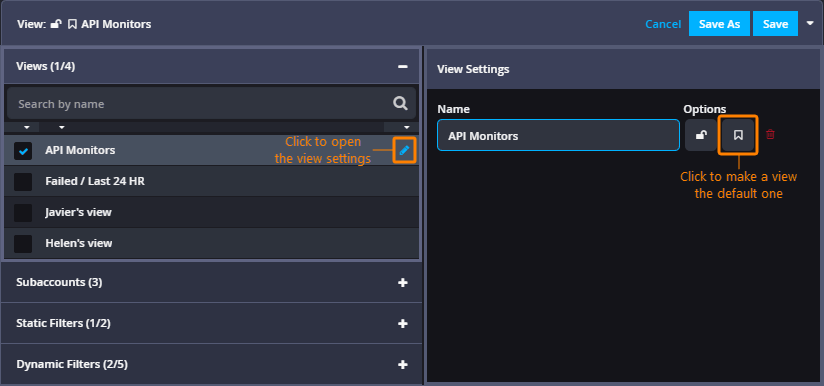
Default view is activated by default when you open the dashboard. The default view is indicated by the solid bookmark icon in the view settings. Default views are user-specific and each user can have their own default view.
| Tip: | For your default view, select only the monitors you are responsible for or must focus on. |
When you create a view, there is an option to set it as the default one. You can also change your default view at any time.
Public and private views
Views can be public (shared) and private, which determines who can see them.
public views are shared with all users in your AlertSite account. This is the default option for new views. Public views can contain both public and private monitor groups, but private groups are visible only to the group owners. Other users will see only the public groups in this view.
private views are visible only to you (the logged-in user) and not other users.
Filter the dashboard
Using the Filter panel
-
Click Open Filter Options on the dashboard toolbar.
-
Specify the filter conditions: the search string, monitor types and groups, status (Good or Bad).
For status filters, also select the time period to account for (the default value is last 24 hours).
-
Close the filter panel.
Using the "Select a View" menu
Remove filters
Create views
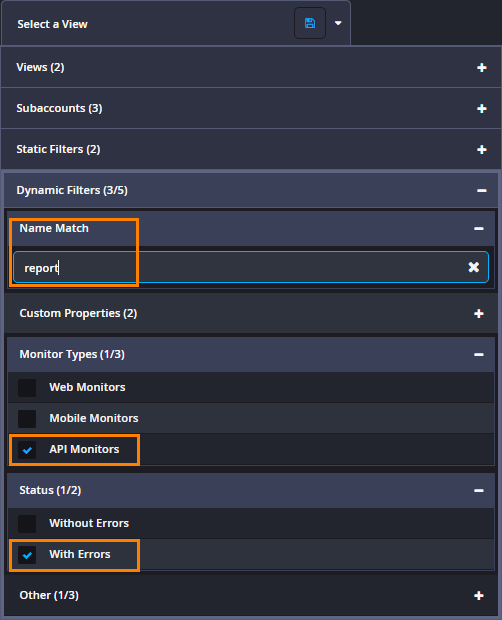
You can create views that include specific monitors, groups, and subaccounts, or that use a filter such as only API monitors or only monitors that failed in the last 12 hours.
To create a view:
-
On the Dashboard, click Select a View.
-
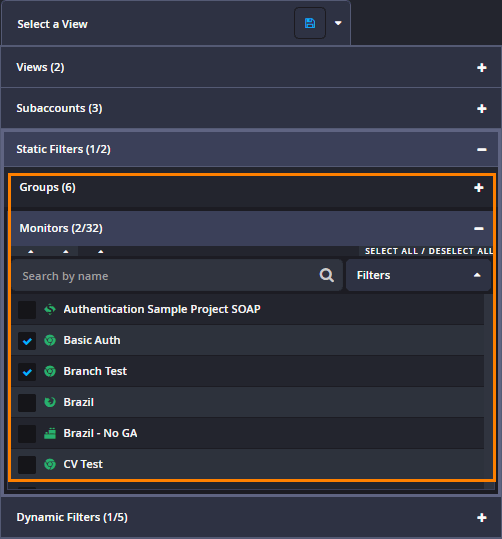
Configure the filters to include the desired monitors, groups, and subaccounts.
 Static Filters: Select specific monitors and groups
 Dynamic Filters: Filter by name, type, status, and other attributes
 -
Click at the top of the Select a View menu.
-
Enter a Name for this view.
-
By default, new views are public. To make them private, click the lock icon so that it becomes .
-
(Optional.) To set the view as default, click the icon so that it becomes solid .
-
Click Save As.
The created view is activated automatically.
Manage views
Set the default view
-
Open the list of views and click next to the desired view.
-
Click the icon so that it becomes solid .
-
Click Save.
Edit a view
To rename a view or change its filter conditions:
-
In the Select a View menu, click next to the view you want to modify.
-
Change the view Name, filter conditions, and other settings as required.
-
Click Save.
Copy an existing view
-
In the Select a View menu, click next to the view you want to copy.
-
Enter the name for the new view.
-
Click Save as new.
Delete a view
-
In the Select a View menu, click next to the view you want to delete.
-
Click and confirm by clicking OK.
Reset the dashboard
To return the dashboard to its default (unfiltered) state, click Clear All under the dashboard toolbar.

Alternatively, you can deactivate the selected view:
-
In the Select a View menu, clear the check box next to the active view.
-
If a message about unsaved changes in the view appears, click OK.


