You can monitor the current state of your project development and testing by using various reports and dashboards.
To run reports:
-
Go to Reports.
-
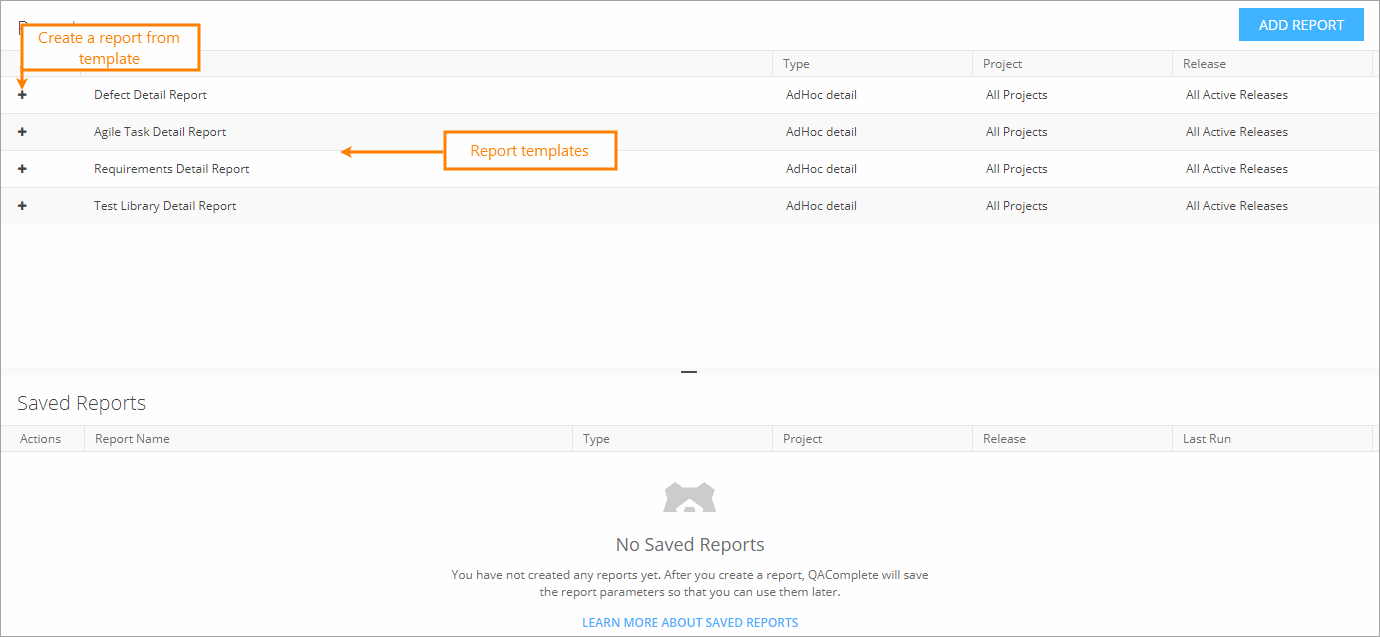
To create a new report, select a report template on the basis of which you want to create a report and click Add.
To run an existing report, click Run next to the needed report:
-
View the generated report:
You can print the report or export it to an external file.
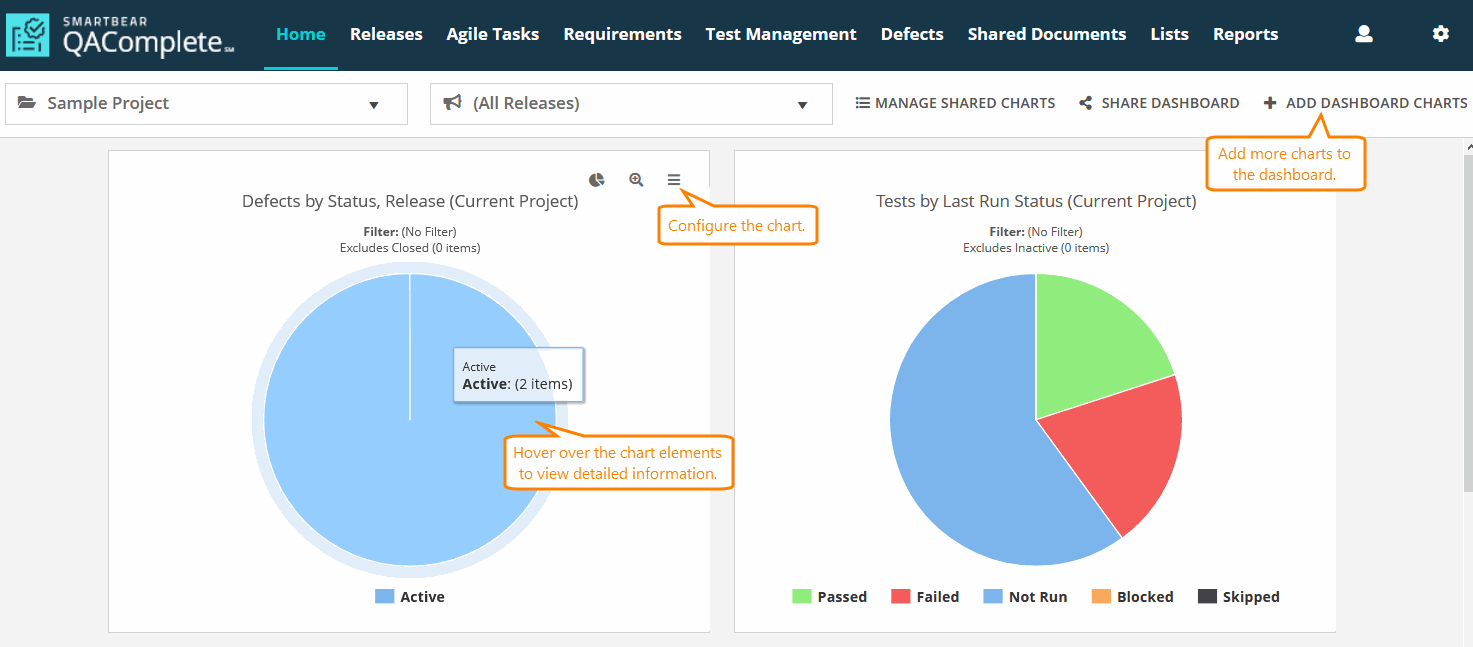
You can also use dashboard charts to get the graphical representation of your project’s current state. Go to Home > Dashboards to view the charts:
See Also
Dashboards
About Reports
Getting Started with QAComplete - User Tutorial


 Prev
Prev