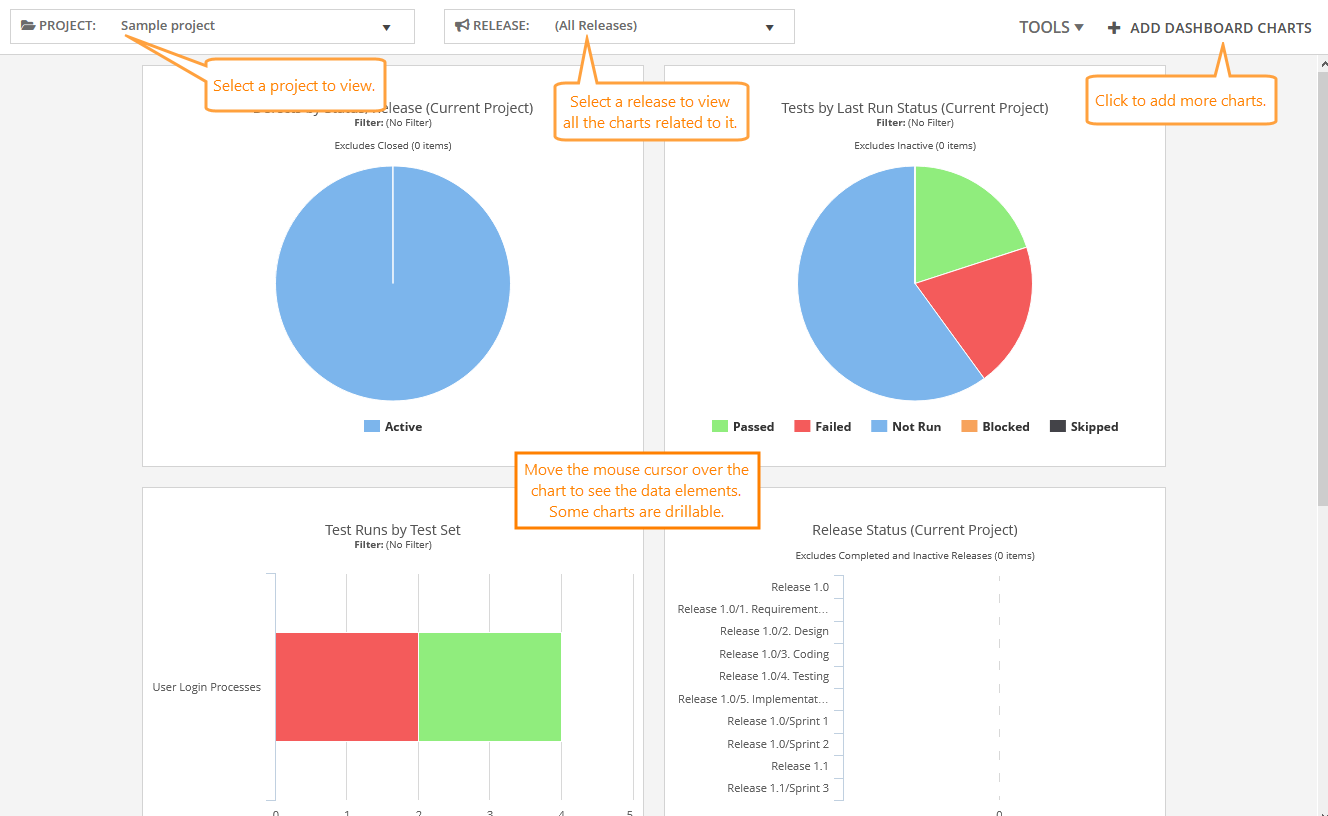
The Dashboards screen appears when you are logging in to QAComplete for the first time. It contains various dashboards: use them to quickly spot trends and inspect statuses of items.
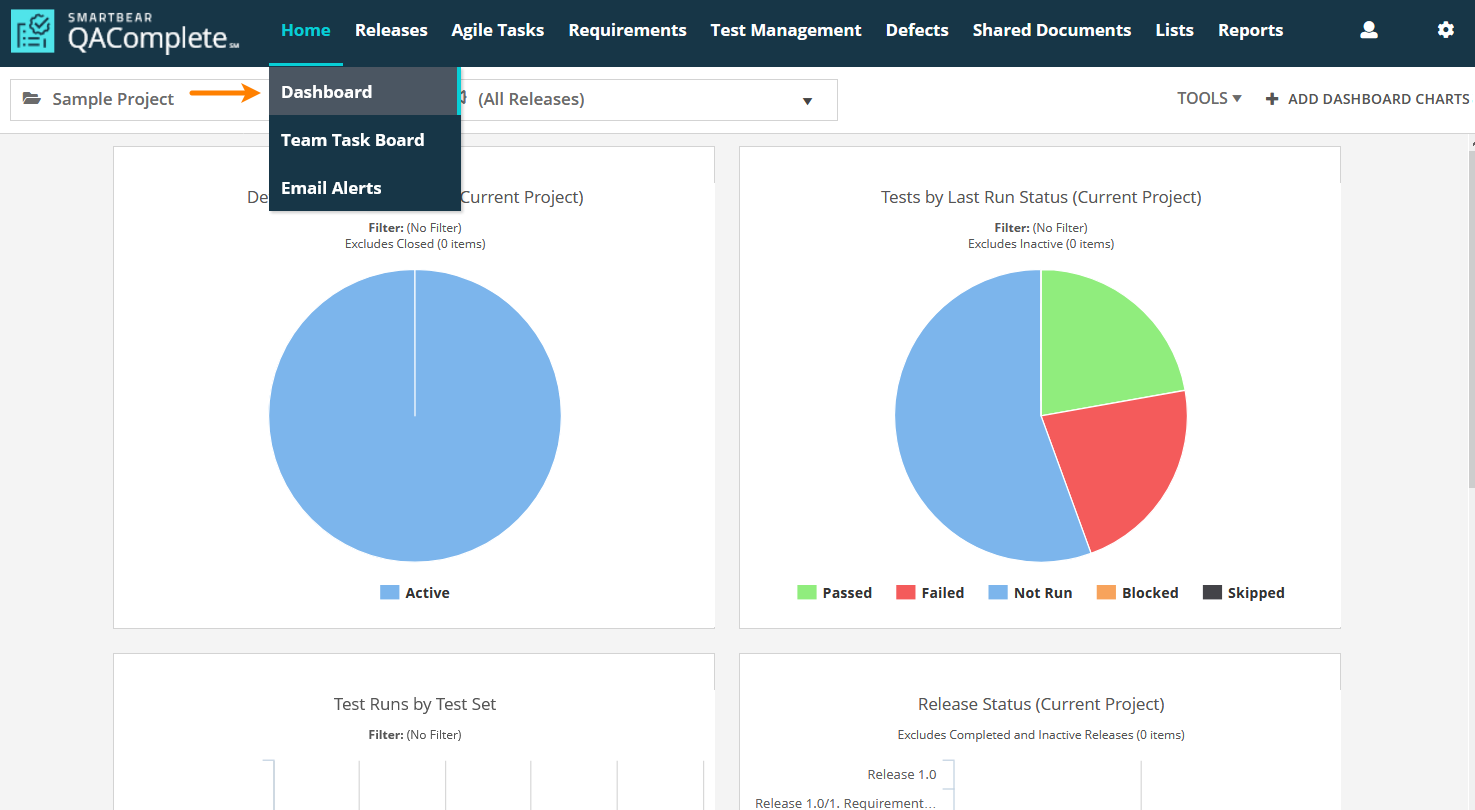
To access the Dashboards screen later, go to Home > Dashboards.
By default, only the dashboards for the currently selected project appear. To switch to another project, select it on the drop-down list in the top left corner of the screen.
Here, the following options are available:
-
To add a chart: Click Add Dashboard Charts. The available charts will appear to the right. Drag those charts you need somewhere within the dashboard.
-
To remove a chart: Move the mouse cursor over the chart to see the menu button. Click it, then click Delete.
-
To change the selected filter or release: Move the mouse cursor over the chart to see the menu button. Click it, then click Filter. Use drop-down lists to select a filter and release.
Note: You can also select a release from the Release drop-down menu to view all the charts related to that release.
-
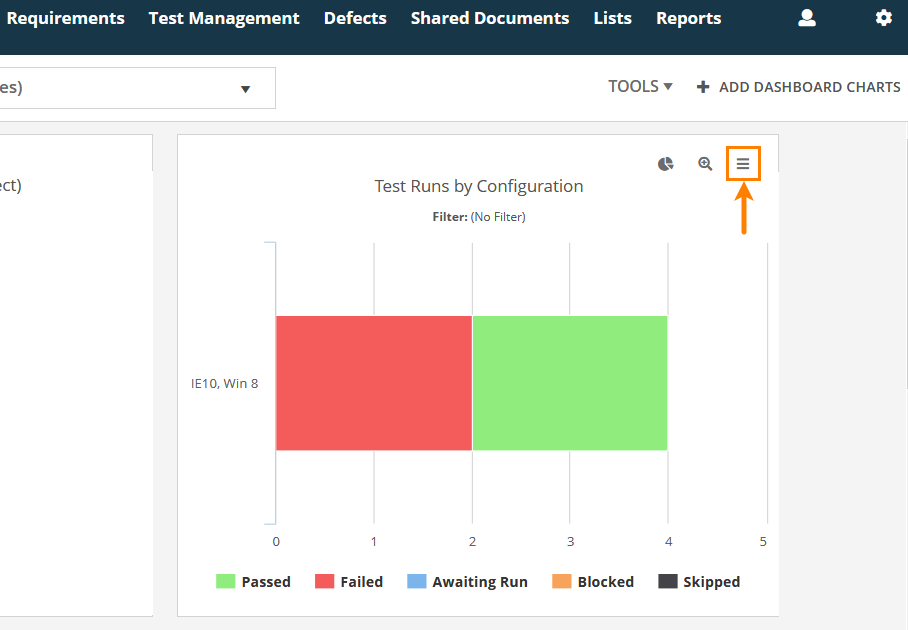
To show numeric values on dashboard segments: Move the mouse cursor over the chart to see the menu button. Click it, then click . Select the Show Values check box.
Enable and disable dashboard criteria
Under each dashboard image, there is a legend containing the criteria of this dashboard. By default, all the criteria are enabled.
To disable a specific criterion, click it. QAComplete will remove the statistics on the items that meet this criterion from the dashboard.
Download a dashboard PNG
To download a PNG file with a specific dashboard:
-
Move the mouse pointer over the dashboard -- the option buttons will appear in the top right corner.
-
Select > .
Note: If some dashboard criteria were disabled upon requesting a PNG, the resulting image will show the dashboard without these criteria.
Drill-down screens
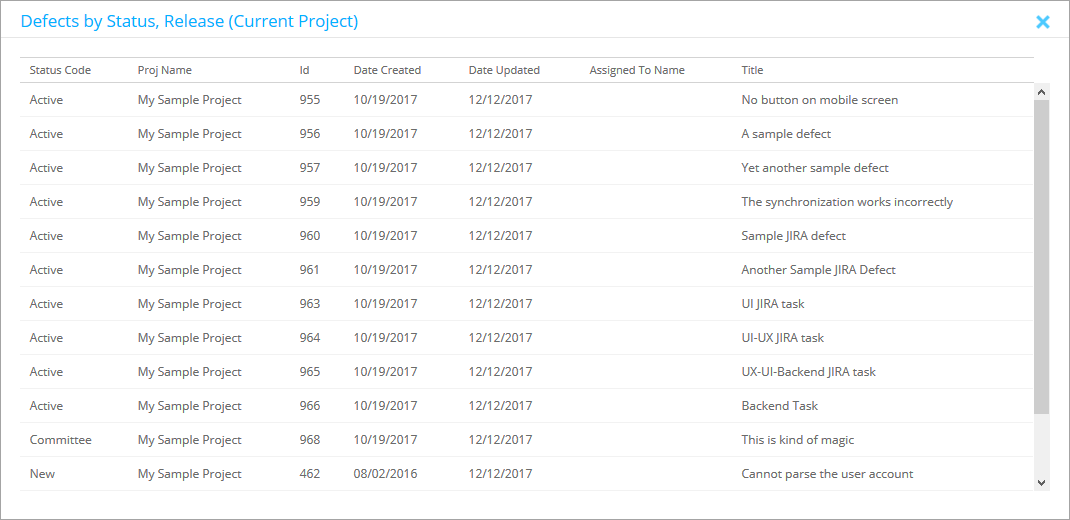
To open a drill-down screen that contains information on the items shown in one of the dashboards, click a chart segment in this dashboard.
For example, the drill-down screen for Defects by Status, Release looks like this:
See below for a description of all screens.
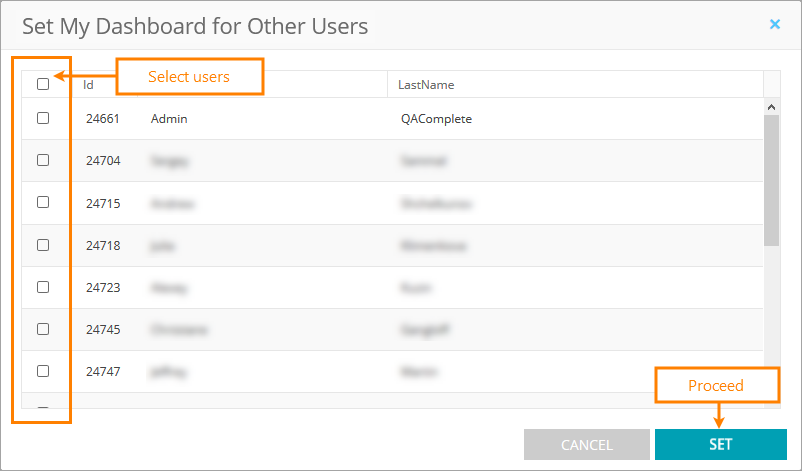
Set your dashboards for other users
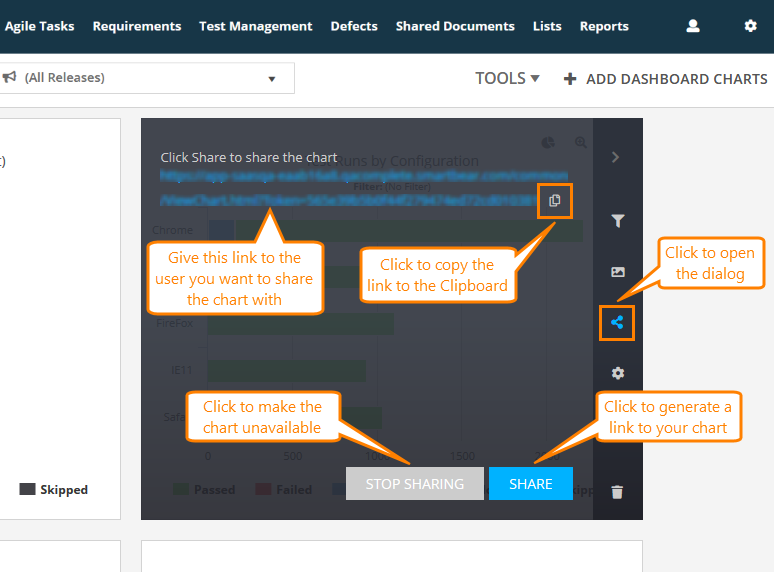
Share charts
Manage shared charts
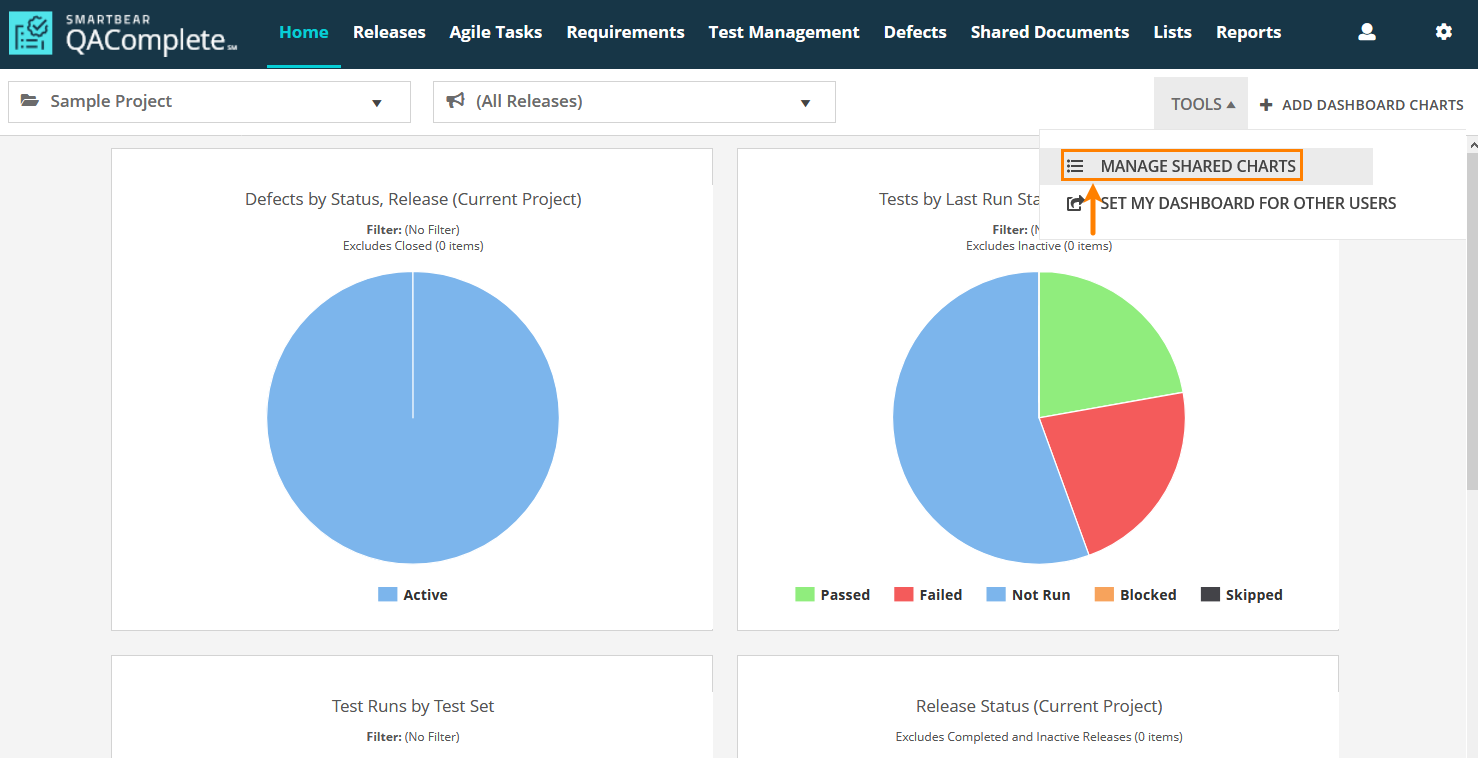
To view and manage shared charts, click Tools > Manage Shared Charts:
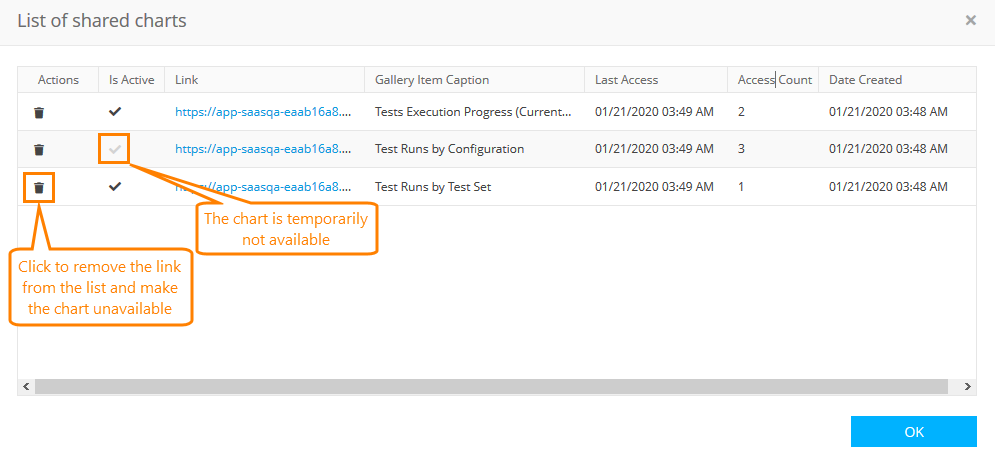
QAComplete will show a list of shared charts:
Here, you can remove a chart from the list, make it available or unavailable, and view relevant information.
 If you want to make a chart temporarily unavailable, disable it in the Is Active column. If you remove a chart from the list, it will become unavailable, and when you share it next time, it will have a different URL.
In the dialog, the following columns are available:
| Column | Description |
|---|---|
|
Actions |
Click to remove the chart from the list. |
|
Is Active |
If enabled, the chart is available. |
|
Link |
The link to the chart you can share with users. Clicking the link will open the chart in your browser. |
Gallery Item Caption |
The chart name. |
|
Last Access |
The date and time the chart was last accessed. |
|
Access count |
The number of times the chart was accessed. |
|
Date Created |
The date and time the chart was shared. |
Chart types
The available charts are organized into categories:
Requirements
-
My Requirements by Status (Active Projects)—Drillable. Shows all requirements assigned to the currently logged in user across all active projects, sorted by status.
On the drill-down screen, the information on all relevant requirements is shown in the table format.
-
Open Requirements Trending by Folder - Past 14 months — Shows how a number of requirements in the selected folder or all folders have changed in the past 14 months.
-
Open Requirements Trending by Release - Past 14 months — Shows how a number of requirements associated with the selected release or all releases have changed in the past 14 months.
-
Percentage Complete by Requirement — Shows the completion percentage for each requirement.
-
Requirement Test Coverage — Shows how many tests have been associated with each requirement. Tests are sorted by status.
-
Requirements by Assignee, Folder — Drillable. Shows how many requirements in the selected folder or all folders are assigned to specific users.
On the drill-down screen, the information on all relevant requirements is shown in the table format.
-
Requirements by Assignee, Release — Drillable. Shows how many requirements associated with the selected release or all folders are assigned to specific users.
On the drill-down screen, the information on all relevant requirements is shown in the table format.
-
Requirements by Group, Folder — Drillable. Shows how many requirements in the selected folder or all folders belong to specific groups.
On the drill-down screen, the information on all relevant requirements is shown in the table format.
-
Requirements by Group, Release — Drillable. Shows how many requirements associated with the selected release or all releases belong to specific groups.
On the drill-down screen, the information on all relevant requirements is shown in the table format.
-
Requirements by Owner, Folder — Drillable. Shows how many requirements in the selected folder or all folders have specific owners.
On the drill-down screen, the information on all relevant requirements is shown in the table format.
-
Requirements by Owner, Release — Drillable. Shows how many requirements associated with the selected release or all releases have specific owners.
On the drill-down screen, the information on all relevant requirements is shown in the table format.
-
Requirements by Status, Folder — Drillable. Shows how many requirements in the selected folder or all folders currently remain in specific statuses.
On the drill-down screen, the information on all relevant requirements is shown in the table format.
-
Requirements by Status, Release — Drillable. Shows how many requirements associated with the selected release or all releases remain in specific statuses.
On the drill-down screen, the information on all relevant requirements is shown in the table format.
-
Requirements Trending, Folder — Shows statistics on how the statuses of the requirements in the selected folder or all folders have changed in the past 14 days.
-
Requirements Trending, Release — Shows statistics on how the statuses of the requirements associated with the selected release or all releases have changed in the past 14 days.
Test cases
-
Test Cases by Status(Active Project) — Drillable. Shows how many test cases in the Active project remain in specific statuses.
On the drill-down screen, the information on all relevant test cases is shown in the table format.
Test Status in last test set run — Drillable. Shows how many test cases in the last test set run.
On the drill-down screen, the information on all relevant test cases is shown in the table format.
Test Cases by Status(Current Project) — Drillable. Shows how many test cases in the current project remain in specific statuses.
On the drill-down screen, the information on all relevant test cases is shown in the table format.
My TestSets by Status(Active Project) — Drillable. Shows how many test cases in the Active project remain in specific statuses.
Test Cases by Status — Drillable. Shows how many test cases in the current project remain in specific statuses.
On the drill-down screen, the information on all relevant test cases is shown in the table format.
Defects
-
Defect Trending by Folder — Shows statistics on how the statuses of the defects in the selected folder or all folders have changed in the past 14 days.
-
Defect Trending by Release — Shows statistics on how the statuses of the defects associated with the selected release or all releases have changed in the past 14 days.
-
Defects by Assignee, Release — Shows how many defects associated with the selected release or all releases are assigned to specific users.
On the drill-down screen, the information on all relevant defects is shown in the table format.
-
Defects by Priority, Folder — Drillable. Shows how many defects in the selected folder or all folders have specific priorities.
On the drill-down screen, the information on all relevant defects is shown in the table format.
-
Defects by Priority, Release — Drillable. Shows how many defects associated with the selected release or all releases have specific priorities.
On the drill-down screen, the information on all relevant defects is shown in the table format.
-
Defects by Requirement, Release — Drillable. Shows how many defects associated with the selected release or all releases are linked to specific requirements.
On the drill-down screen, the information on all relevant defects is shown in the table format.
-
Defects by Severity, Folder — Drillable. Shows how many defects in the selected folder or all folders have specific severity statuses.
On the drill-down screen, the information on all relevant defects is shown in the table format.
-
Defects by Severity, Release — Drillable. Shows how many defects associated with the selected release or all releases have specific severity statuses.
On the drill-down screen, the information on all relevant defects is shown in the table format.
-
Defects by Status, Folder — Drillable. Shows how many defects in the selected folder or all folders remain in specific statuses.
On the drill-down screen, the information on all relevant defects is shown in the table format.
-
Defects by Status, Release — Drillable. Shows how many defects associated with the selected release or all releases remain in specific statuses.
On the drill-down screen, the information on all relevant defects is shown in the table format.
-
My Defects by Status (Active Projects) — Drillable. Shows all requirements assigned to the currently logged in user across all active projects, sorted by status.
On the drill-down screen, the information on all relevant defects is shown in the table format.
-
Open Defects Trending - Past 14 months — Shows how a number of open defects in the current project have changed in the past 14 months.
-
Defect Severity Trending by Folder — Shows statistics on how the severity of the defects in the selected folder or all folders has changed in the past 14 days.
-
Defect Severity Trending by Release — Shows statistics on how the severity of the defects associated with the selected release or all releases has changed in the past 14 days.
Agile tasks
-
Agile Task Burndown
-
Agile Task Resource Allocation by Assignee — Shows the distribution of actual, estimated, and remaining estimated hours for working on the agile tasks of the current project between specific users.
-
My Slipping Agile Tasks (Active Projects) — Drillable. Shows all active agile tasks assigned to the currently logged in user across all projects.
On the drill-down screen, the information on all relevant agile tasks is shown in the table format.
-
Slipping Agile Tasks by Assignee — Drillable. Shows active agile tasks in the current project, sorted by assignee.
On the drill-down screen, the information on all relevant agile tasks is shown in the table format.
Releases
-
Release Status — Shows the estimated and actual hours percentage for each release in the current project.
-
Release Velocity Monthly Velocity — Shows how the amount of actual, estimated, and remaining estimated hours for all releases of the current project has changed monthly.
-
Release Velocity - Past 2 weeks — Shows how the amount of actual, estimated, and remaining estimated hours for all releases of the current project has changed in the past 2 weeks.
-
Resource Allocation by Assignee — Shows the distribution of actual, estimated, and remaining estimated hours for working on the releases of the current project between specific users.
-
Release Burndown
QA
-
Tests by Last Run Status — Drillable. Shows all tests in the current project, sorted by status.
On the drill-down screen, the information on all relevant tests is shown in the table format.
-
Test Library by Assignee — Drillable. Shows all the Test Library tests in the current project, sorted by assignee.
On the drill-down screen, the information on all relevant tests is shown in the table format.
-
Test Runs by Assignee — Drillable. Shows all test runs in the current project, sorted by assignee.
On the drill-down screen, the information on all relevant test runs is shown in the table format.
-
Test Runs by Configuration — Drillable. Shows all test runs in the current project, sorted by the configuration used to run the test.
On the drill-down screen, the information on all relevant test runs is shown in the table format.
-
Test Runs by Requirement — Shows all test runs in the current project, sorted by linked requirement.
-
Test Runs by Test Set — Drillable. Shows all test set runs in the current project.
On the drill-down screen, the information on all relevant test set runs is shown in the table format.
-
Test Library Runs by Folder — Shows all test runs in the current project, sorted by the folder the related tests are located in.
-
Test Set Runs by Folder — Shows all test set runs in the current project, sorted by the folder the related test sets are located in.
-
Test Execution Progress — Shows the execution progress of the tests in the current project.
-
Test Set % Complete — Shows the execution progress of the tests in test sets. Includes only tests in the Awaiting Run and Complete statuses.
On the drill-down screen, the information on all relevant test set runs is shown in the table format. Use hyperlinks to navigate directly to the Test Runner with the test set opened.
-
Tests Assigned to Me — Shows the test runs for tests assigned to the currently logged in user, sorted by status.
On the drill-down screen, the information on all relevant test set runs is shown in the table format. Use hyperlinks to navigate directly to the Test Runner with the test set opened.
-
Test Runs by Release — Shows all test runs in the current project, split between releases, sorted by status.
-
Test Set Runs by Release — Shows all test set runs in the current project, split between releases, sorted by status.
-
Test Set by Last Run Status — Shows all test set runs in the current project, sorted by status.
On the drill-down screen, information on all relevant test sets is shown in a table format.
-
Test Execution Burndown — Shows the burn down statistics on tests and test sets associated with a specific release (sorted by actual and planned dates).
On the drill-down screen, information on all relevant tests and test sets is shown in a table.
-
Test Run Trends — Shows how the number of passed, failed and running tests changes over time.
-
Test Trending by Last Run Status — Shows the last test run status for each test run day.

