
The Navigation Timings chart on the Charts tab of the test results screen shows the network timings as the virtual user is loading the page in its browser.
Timings notably affect the user experience, so it is recommended that you keep these values as low as possible. Many factors have their effect on timings, including the network speed, server response time, and size of the website’s content.

Click the image to enlarge it.
Working with the chart
-
To show only one graph, double-click the name of this graph in the chart legend.
-
To stop showing a graph, click the name of its graph in the chart legend once.
-
To zoom in a segment of a chart, select it with your mouse.
-
To restore the default scaling of a chart, double-click on its legend.

Click the image to enlarge it.
The diagram includes the following measurements:
-
Horizontal — The duration of the test run.
-
Vertical — The average time for each metric in milliseconds; the number of virtual users.
Navigation timings
LoadNinja counts the following navigation timings, one after another:
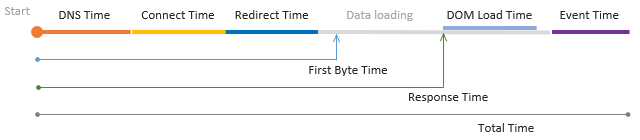
Each timing is counted separately. The total time is the overall duration of the load test.
Graphs
Graphs appearing by default represent different stages of the load test:
| Graph | Description | ||
|---|---|---|---|
|
DNS Time |
The time spent performing a DNS lookup, that is, obtaining the IP address of the website from a DNS server. If this value is elevated, it indicates that a virtual user had problems with reaching the DNS server and retrieving its response. |
||
|
Connect Time |
The time spent performing a TCP handshake, that is, establishing a connection to a web server after the DNS lookup. If this value is elevated, this indicates possible network and routing problems or low efficiency of the server bandwidth. |
||
|
Redirect Time |
If the tested website has initially responded with an HTTP 301 or 302 redirect, this shows the time that a virtual user spent following the redirects until getting to the final URL. There may be several redirects, each needing another DNS lookup, TCP connection, and HTTP request, so the redirect time can be represented in greater details like this: 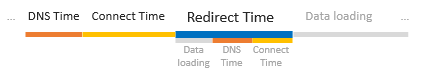
|
||
First Byte Time |
The time spent waiting for the first byte of the response from the server. Its duration includes processing the requests, accessing the database of the server, selecting and generating the response, and depends on the server performance mostly. If this value is elevated, this indicates a possible high server load, problems with database queries, memory leaks, or other performance issues. |
||
|
Response Time |
The execution time of the first request on the page (the first page in the test step). That is, the total time passed from the moment when the client sent the composed request until the moment when the page’s HTML code got downloaded. |
||
DOM Load Time |
The total time it took to load and construct the DOM. The DOM is considered completed when the |
||
|
Event Time |
The time it took the page’s |
||
|
Total |
The total time it took to run the load test. |
||
|
Virtual Users |
The number of virtual users. |
View filtered results
By default, LoadNinja shows metrics for the whole load testing scenario. To command it to demonstrate data only on a specific UI or API test, use the drop-down list on the left:

Click the image to enlarge it.
To retrieve data on a specific URL, select the test step that works with this URL in the View drop-down list above:

Click the image to enlarge it.