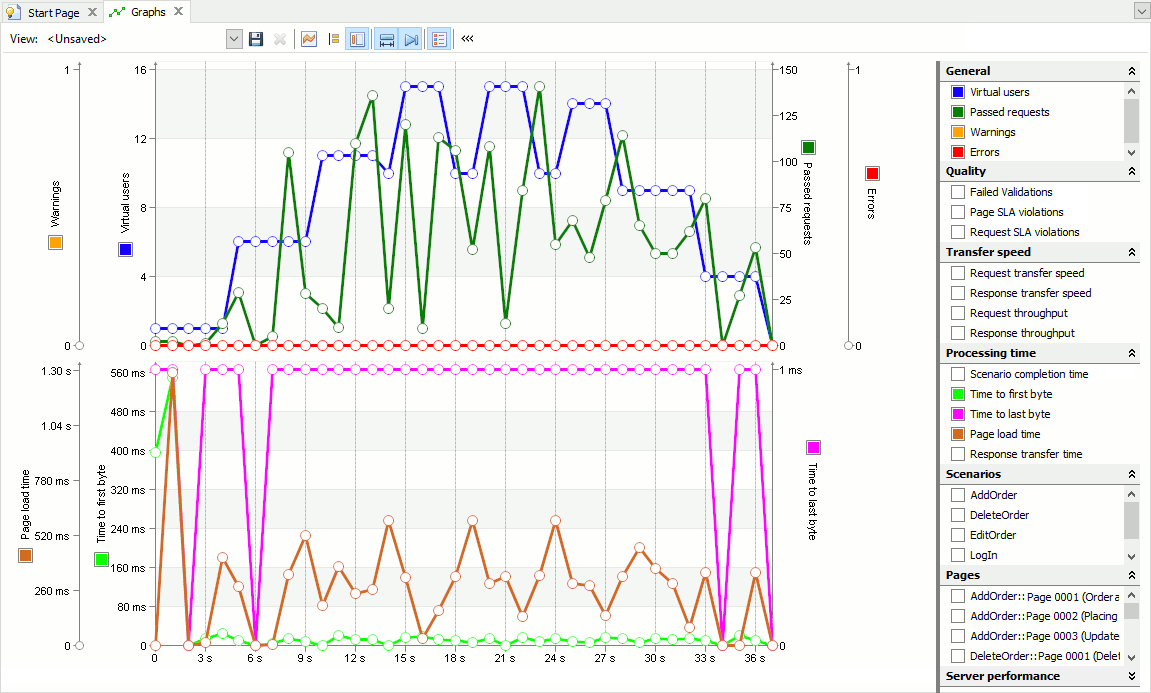
During the load test run, LoadComplete measures various parameters on the computers where virtual users are simulated. You can view these parameters as counters (metrics) on the Runtime > Graphs page of your project:
| Note: | This topic describes the metrics that measure the performance of a web application or web site from the client point of view. For information on the metrics that measure the server performance, see About Server Monitoring. |
LoadComplete plots the counters in real time during the test run.
Supported Counters
You can monitor the following counters in your load tests. On the Runtime > Graphs page, the counters are grouped by the data they measure:
General |
|
| Virtual users | The number of virtual users that are currently involved in the test. |
| Passed requests | The number of successful requests that were sent to the tested server since the last measurement of this parameter. Since the measurements are done every second, this is actually the number of successful requests sent per second. |
| Errors | The number of errors that have occurred since the last call. |
| Warnings | The number of warnings that have occurred since the last call. |
Quality |
|
| Failed Validations | The number of failed validations that have occurred by the current moment during the test run. |
| Page SLA violations | The number of times the SLA criteria for pages were violated (occurs when the page load time exceeds the specified threshold). |
| Request SLA violations | The number of times the SLA criteria for requests were violated (occurs when the response transfer time exceeds the specified threshold). |
Transfer speed |
|
| Request transfer speed | The speed at which requests are transferred to the server. It is estimated as a ratio of the request size to the time it takes to send the request. |
| Response transfer speed | The speed at which responses are transferred from the server. It is estimated as a ratio of the response size to the time it takes to receive the response. |
| Request throughput | The amount of data sent to the server per second. |
| Response throughput | The amount of data received from the server per second. |
Processing time |
|
| Response transfer time | The time between the first byte and the last byte of the response arriving. |
| Time to first byte | The time between the first byte of the user request and the first byte of the server response. |
| Time to last byte | The time between the first byte of the user request and the last byte of the server response. |
| Page load time | The average time spent on downloading all the pages of test scenarios at the moment, including all the images, scripts, CSS files and so on. To view the time spent on loading an individual page, enable the appropriate metric in the Pages section (see below). |
| Scenario completion time | The average time spent on executing all scenarios in the test completely (from the first request of a scenario to the response to the last request). The measurements are made every second for all scenarios completed at that moment. |
Scenarios |
|
| <Scenario_Name> | The number of individual <Scenario_Name> scenarios whose simulation has finished by the current moment. The measurements are made every second. The metric is calculated regardless of whether the scenario was simulated with errors or warnings. |
Pages |
|
| <Scenario_Name::Page_Name> | The time spent on downloading the <Scenario_Name> scenario’s <Page_Name> page completely (including all the images, scripts, CSS files and so on), by the current moment. A page is considered downloaded completely if all its requests have been simulated completely and correctly (if a request violates the SLA criteria, it is still considered passed).
If a page contains at least one request simulated with an error or simulated incompletely, it is excluded from the calculation. If an SLA criterion (maximum load time) is specified for a page either in a scenario or in a test, the criterion value will be shown on the graph as a dash line. |
Transactions |
|
| <Scenario_Name::Transaction_Name> | The number of the <Scenario_Name> scenario’s individual user-defined <Transaction_Name> transactions, whose simulation has finished by the current moment. The measurements are made every second.
If a transaction has an SLA criterion specified, the criterion value will be shown on the graph as a dash line. |
| Note: | When you zoom the graphs, LoadComplete re-scales the axes automatically. |
See Also
About Server Monitoring
Managing Server-Side Performance Counters
Server Monitoring

