Before Exporting the Results
Open the needed Report test log.
 To export custom charts and data tables, switch to the Custom Charts page of the Report log so that LoadComplete can generate them. Otherwise, no custom charts or data tables will be generated and LoadComplete will not be able to export them.
To Export Test Results
-
Click Export to PDF on the Report panel toolbar.
-
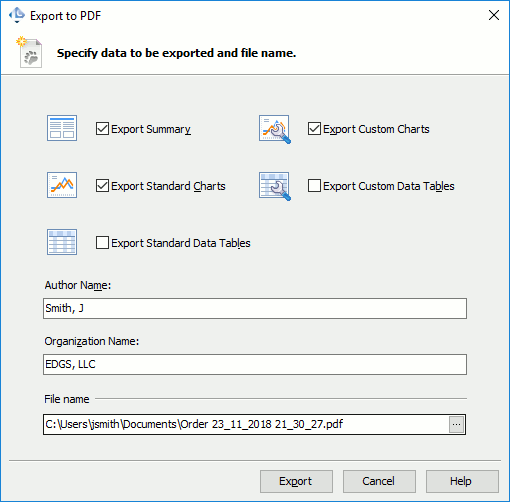
In the resulting Export to PDF dialog, select the results to export:

-
Select Export Summary to include the Summary page in the exported report.
-
Select Export Custom Charts to include the Custom Charts page in the exported PDF report.
-
Select Export Standard Charts to include the other pages (Pass / Fail, Response Times, Infrastructure and Top 10) in the exported PDF report.
-
Select Export Custom Data Tables to include the contents of the Data Table tabs shown on the Custom Charts page in the exported PDF report.
-
Select Export Standard Data Tables to export the test results both as graphs and in a tabular form.
-
-
If needed, enter your name and the name of your company in the Author Name and Organization Name text boxes. This data will be included in the exported report.
-
Enter the path to the .pdf file to which you want to export the results. You can type the name manually or click the ellipsis button and browse for the needed file location. By default, the resulting .pdf files are saved to the <User Data>\Documents folder.
-
Click Export to export the results with the specified settings.
LoadComplete will export test results to the specified .pdf file. If you have software for viewing .pdf files on your computer, LoadComplete automatically opens the resulting file in it. Otherwise, LoadComplete opens the folder containing the file in Windows Explorer.
Important notes:-
Not all results are exported to .pdf files. For example, exported results of cloud tests do not include Chart by Region graphs. Exported results of scenarios that call subscenarios or of tests that simulate several scenarios do not include completion time of each individual subscenario, only the overall completion time.
-
If your load test includes user-defined transactions, the exported results will include the following additional metrics:
-
90th, 95th, 98th, 99th percentile completion time – The completion time value that covers 90%, 95%, 98% and 99% of the transactions respectively.
-
Standard deviation – The standard deviation of the transaction completion time values.
Note: These metrics are not available in the test logs you view in LoadComplete. -
