Along with other graphs, LoadComplete provides you with graphs that contain a list of the slowest pages loaded during the test run. The graphs are: Slow Pages Section and Slow Pages (Average) Section. For each page displayed on these graphs you can obtain a list of requests sent from this page during the test run.
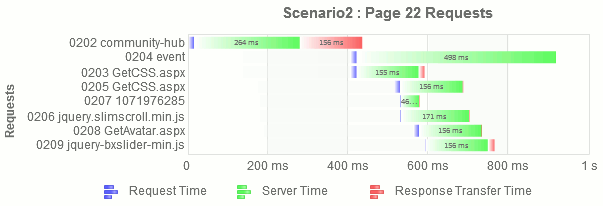
The requests are shown on the "waterfall" graph that shows when each request was simulated. For each request, the graph shows the request ID and URL, the request time (the time spent on sending the request), the server time (the time the server spent to process the request) and the response transfer time (the time it took the response to arrive).
A sample view of the graph is below:

If you hover the mouse pointer over a request line, the graph will show a hint containing additional information on the request - the request’s Time To First Byte metric (the sum of its request time and server time) and the response transfer time.
This graph is very helpful when you need to learn why a certain page was being loaded for a long time. Also, you can use it to learn which request was simulated longer than the others and so on.
Viewing the Graph
To view this graph, do the following:
-
Open the desired report test log item. For this purpose, right-click the Report node under the desired log node in the Project Explorer panel and select Open from the ensuing context menu.
-
The log will be opened in the Report panel.
-
Switch to the Top 10 tabbed page.
-
Expand either the Slow Pages or the Slow Pages (Average) section.
-
Click the line that corresponds to this page in the table.
-
The graph containing information on the requests sent from the page will be displayed.
Notes on the Page Load Time Value
The page load time displayed in the Page Load Time column may slightly differ from the time you estimate as the sum of the last request’s time and its start time displayed on the graph. This happens because –
-
The values on the graph do not include the time LoadComplete spends on sending requests and receiving and processing responses (for example, the time spent on extracting data from server responses by using data selectors, verifying the extracted data by using validation rules and so on).
-
For the Slow Pages (Average) section only:
-
The graph represent a time scale with "average requests" for the given "average page". Since LoadComplete calculates average request time and average page load time using different sets of metrics, the sum of request times can slightly differ from the page load time shown for the given page in the Page Load Time column.
-
When you run a load test with the Continuous load option enabled, requests are not always simulated in the order they were recorded. They can also be simulated in parallel. As a result, the average page load time displayed in the Page Load Time column may also differ from the time you estimate by using the values on the graph.
-
Working With the Graph
This section contains information on the basic actions that you can perform against the graph.
To obtain the entire URL of the requested resource
-
Hover the mouse over the desired line in the Requests list.
-
A hint containing the entire URL of the requested resource will pop up.
To obtain the requested URL along with the TTFB metric
-
Hover the mouse over the desired line shown on the graph.
-
A hint containing the entire URL and the values of the TTFB and Response Transfer Time metrics will pop up.
To hide some metrics
-
Click a legend shown under the graph.
-
To show a hidden line on the graph, click its legend under the graph one more time.
To print the graph
-
Right-click the graph.
-
Select Print Chart from the ensuing context menu.
Analyzing the Graph
As it has been said above, the graph that shows requests sent from a certain page is also helpful when you need to know why this page was being loaded for a long time. This section contains a description of typical situations that may occur during the test run and explains how you can find the reason of such situations by analyzing the request graph.
In the ideal case, the test must send a new request right after it has received a response to the previous request. However, typically, not all requests are sent after each other. Below is a description of two situations that frequently occur during load testing and the reasons of such situations.
The time passed between two requests is too long
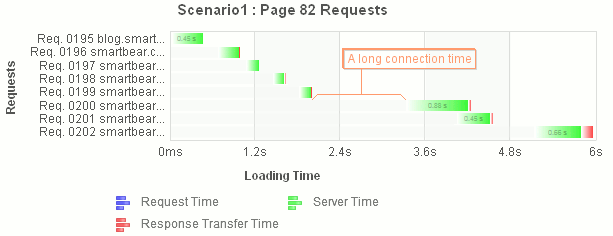
As it was said above, the time passed between two requests is typically small because LoadComplete sends a request to the server right after it has received a response to the previous request. However, sometimes, you may face a situation when the time passed between two requests is too long (a few seconds or even minutes). The image below demonstrates such a situation:

There are several reasons that may cause these test results. The most frequent reason is that LoadComplete was establishing a connection to the target web server for a long time.
Two requests were simulated at the same time
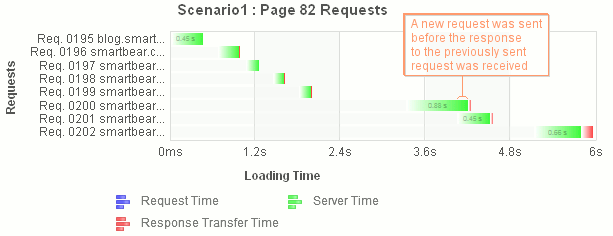
One more typical situation is when LoadComplete simulates two requests at the same time:

There are several possible reasons of such a situation. For example, there may be some problems with receiving responses (a timeout has been reached). One more reason is that an error occurred while receiving a response. In this case LoadComplete could “think” that the response would not be received and proceed with the next request. However, the response was received after the next request was sent to the server.
Typically, it is hard to find a perfect solution to all the problems as it depends on the tested server, simulated requests and so on. However, you can try to modify the server application's code that is used to address an appropriate resource (an image, file, URL and so on).
See Also
Slow Pages Section
Slow Pages (Average) Section
Top 10 Page of the Report Panel
Report Panel
About Test Results
Test Result Panels
Creating and Configuring Load Tests

 Viewing the Graph