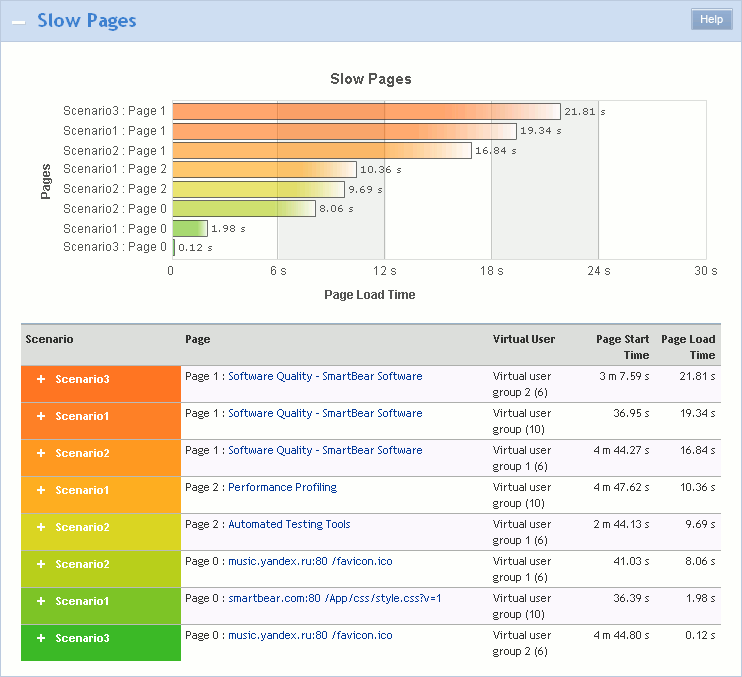
The Slow Pages section of the Report panel contains information on the slowest pages that were accessed during the test run. The header of the section contains a list of pages that have the longest page load time.
The Top 10 list includes only unique pages. That is, if a page was simulated several times during the test run, only the slowest one will be included in the list.
Note: The Top 10 list does not include pages that were simulated partially during continuous load, pages with validation errors and pages that contain requests simulated with errors. Pages that contain warnings or SLA violations are considered successful and are included in the Top 10 list.
To View the Section
-
Open the desired Report item (if it is not open yet). To do that, double-click the log’s Report node under the Project_Name Logs folder in the Project Explorer panel.
-
In the Report panel, select the Top 10 tab and expand the Slow Pages section.
Requirements
To view this graph, set the Store log data option to All data (Report + Details). Do this before running your test. Otherwise, the graph will not be shown.
| Note: | During scenario verification, LoadComplete ignores the logging option and saves all the required data anyway. |
The Slow Pages List
The list contains ten slowest pages that were accessed by the test, that is, the pages that have the longest page load time.
Along with the URLs, the list also contains a diagram with a graphical representation of the pages’ load time. This diagram specifies the load time of each page from the list. Note that the color that corresponds to a page in this diagram is also used to highlight the page’s URL in the table under the list.
The Loading Time Table
The table contains statistics on the load time of the slowest pages in a tabular format. The following columns are available:
| Column | Description | ||
|---|---|---|---|
| Scenario | The name of the scenario that accessed the specified page. | ||
| Page | The URL of the page. | ||
| Virtual User | The virtual user that loaded the page at the specified time.
|
||
| Page Start Time | The time when LoadComplete started loading the specified page. | ||
| Page Load Time | The overall page load time. |
To get detailed information on the page and on the requests that were sent from this page, click the appropriate line in the table – a graph containing the detailed information will pop up.
The graph displays a list of requests sent from the page during the test run. For each request, the diagram displays the request ID and URL, the request time, server time and response transfer time. You can hover over a desired request to view a hint with additional information on the request’s TTFB and response transfer time metrics.
| Note: | The page load time displayed in the Page Load Time column of the Loading Time table does not always correspond to the value you can estimate by the request times displayed on the diagram. This happens because the values on the diagram do not include the time that LoadComplete spends on its internal calculations (for example, while extracting data from server responses). |
For more information on the graph, see Viewing Requests Sent From a Page.
See Also
Top 10 Page of the Report Panel
Viewing Requests Sent From a Page
Report Panel
About Test Results
Test Result Panels
Creating and Configuring Load Tests

