
To demonstrate how you can profile an IIS application in AQTime, we will use the sample program, IISSample, that is installed with AQTime:
 <AQTime Samples>\Unmanaged\IISSample - Borland Delphi
 |
On Windows Vista and later, AQTime samples are located in the <Users>\Public\Documents\AQTime 8 Samples folder. On other operating systems, the samples reside in the <Documents and Settings>\All Users\Documents\AQTime 8 Samples folder. |
Let’s prepare the sample application for profiling:
-
If you use IIS 4 - 6, follow these steps:
-
Open the Control Panel > Administrative Tools > Internet Information Services window.
-
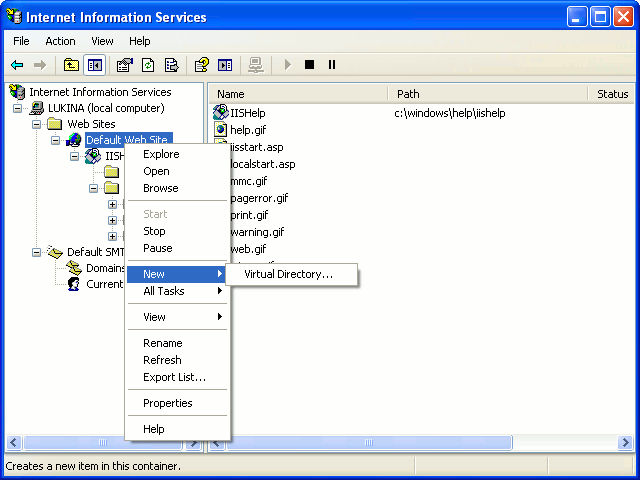
Right-click on Default Web Site in Internet Information Services and select New > Virtual Directory from the context menu.
-
In the resulting Virtual Directory Creation Wizard, specify a name for the virtual directory (say, IISSample) and create the virtual directory in the folder of the IISSample application.
-
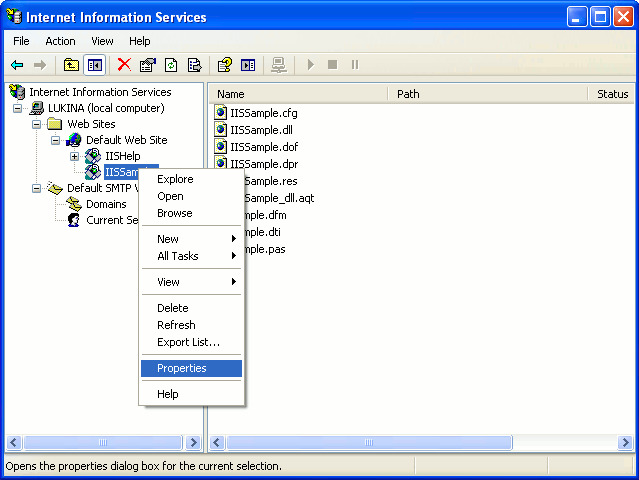
In Internet Information Services, right-click the virtual directory you have created and select Properties from the context menu.
-
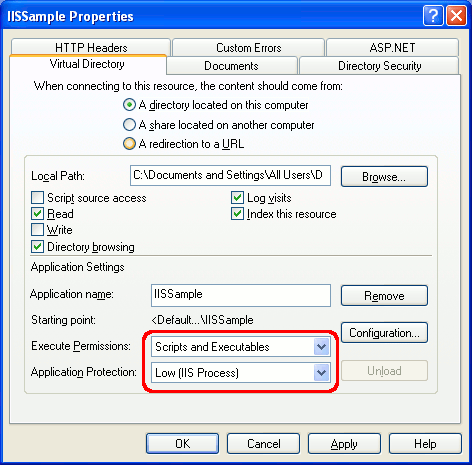
This will open the Virtual Directory Properties dialog. In the dialog:
-
Select Scripts and Executables in the Execute Permissions drop-down list.
-
Set the Application Protection option for your IIS application to Low (IIS Process). Since our sample application is a dynamic link library, this will make the DLL run in the address space of the Internet Information Services, so AQTime will be able to profile it.
AQTime can also profile IIS application if the Application Protection option is set to Medium (Pooled) or High (Isolated). If you use any of these values, you should also modify some other IIS settings. For more information, see Profiling IIS Applications.
-
Press OK to close the configuration dialog.
-
We also need to modify properties of the root virtual folder:
-
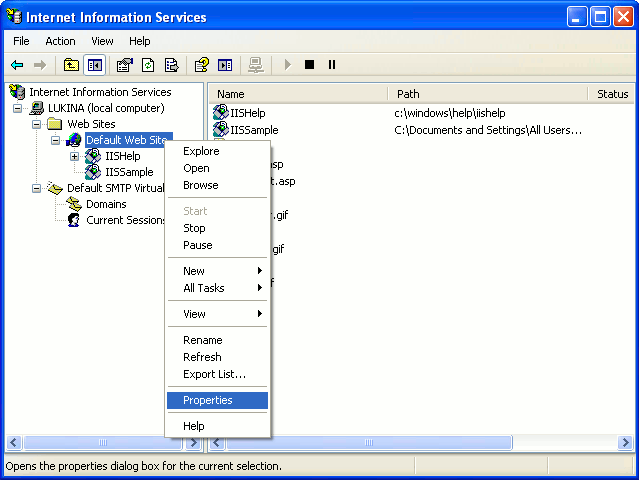
Right-click the root virtual directory in the Internet Information Services dialog and select Properties from the context menu:
-
This will call the Properties dialog for the root virtual directory.
-
In the dialog:
-
Switch to the Home Directory tabbed page.
-
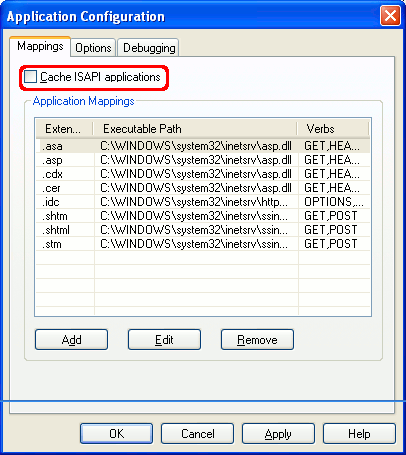
Press the Configuration button on that page. The Application Configuration dialog will appear.
-
Uncheck the Cache ISAPI application box on the Mappings page of this dialog and press OK to save changes.
-
-
-
If you use IIS 7, follow these steps:
-
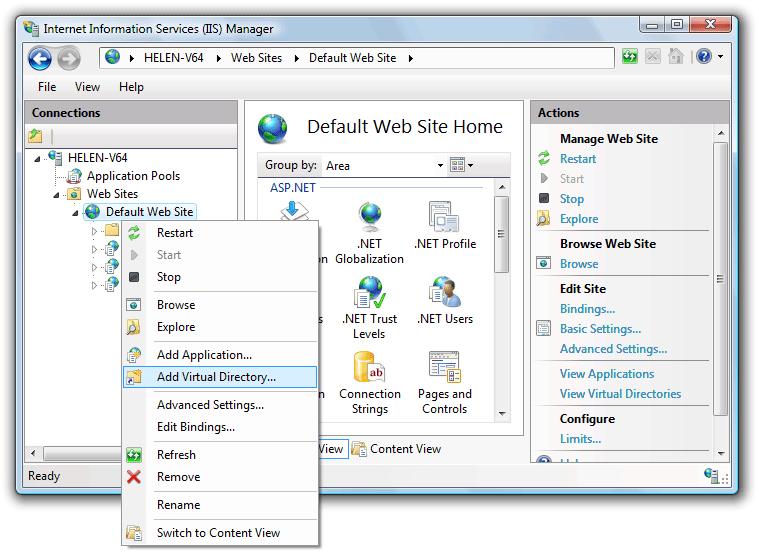
Open the Control Panel > Administrative Tools > Internet Information Services (IIS) Manager window.
-
Right-click the Default Web Site and select Add Virtual Directory from the context menu:
-
In the resulting Add Virtual Directory dialog, specify the alias for the virtual directory (say, IISSample) and map it to the IISSample application’s folder.
-
In the Internet Information Services Manager, select the IISSample virtual directory and double-click Handler Mappings in the Features View.
-
In the Actions pane, click Edit Handler Permissions.
-
In the ensuing Edit Handler Permissions dialog, select the Script and Execute check boxes:
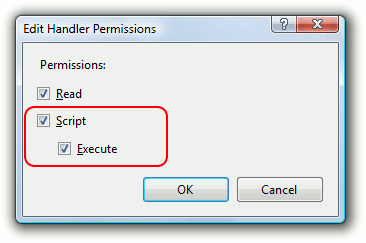
Press OK to close the dialog and save the changes.
-
In the Internet Information Services Manager, select the node corresponding to your web server (this is the top-most node in the Connections tree).
-
Double-click ISAPI and CGI Restrictions in the Feature View.
-
Click Add in the Actions pane.
-
In the ensuing Add ISAPI or CGI Restriction dialog:
-
Specify the path to the <IISSample>\ISSSample.dll file in the ISAPI or CGI Path box.
-
In the Description box, enter any descriptive text, say, IISSample.
-
Select the Allow the extension path to execute check box:
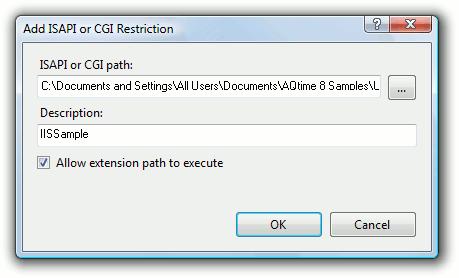
-
Press OK to close the dialog.
-
-
Now we are ready to profile the sample application:
-
Open the sample application in AQTime.
-
Select
 IIS from the Profiling Mode drop-down list box on AQTime’s Standard toolbar.Select IIS from the Profiling Mode drop-down list box on Visual Studio’s AQTime toolbar.Click the IIS button on RAD Studio’s AQTime Profiling Modes toolbar.
 -
Select Run > Parameters from AQTime’s main menu.Select Profiler > Parameters from Visual Studio’s main menu.Select AQTime > Parameters from Embarcadero RAD Studio’s main menu. This will call the Run Parameters Dialog (for IIS Mode).
-
In the Start Page edit box of the dialog, specify http://localhost/IISSample/IISSample.dll. This is the address of the Web page that loads the sample IIS application. AQTime will automatically open this page in Internet Explorer once you start profiling. Press OK to save the changes you made in the Run Parameters dialog.
-
Disable All Project Modules, Entire Script Code and Entire .NET Code in the Setup panel. Create a new line-level profiling area and drag the Sample unit there. (See the topics of the Using Areas section for detailed information on how to define areas and select the code to profile.)
-
Verify that the
 Enable/Disable Profiling item on the Standard toolbarin the AQTime menu of Visual Studioin the AQTime menu of RAD Studio is pressed since AQTime only profiles when this button is pressed.
 -
Now we will subsequently launch each profiler for which the sample application is designed. Let’s start with the Coverage profiler:
-
Select Coverage Profiler from the Profilers drop-down list on the Standard toolbar.Select Coverage Profiler from the Profilers drop-down list displayed in the AQTime menu of Microsoft Visual Studio.Select Coverage Profiler from the Current Profiler submenu displayed in the AQTime menu of Embarcadero RAD Studio.
-
Press
 Run to start profiling. Select AQTime > Run to start profiling. Also you can start profiling by pressing Visual Studio’s
  Run button while any of AQTime panels is active.Select AQTime > Run With Profiling to start profiling. AQTime will restart the IISAdmin service, then it will launch your Internet browser and open the page http://localhost/IISSample/IISSample.dll in it (this is the page we specified in the Start Page box of the Run Parameters dialog. AQTime will open this page in the Internet browser automatically).
 -
Switch to the Web browser, enter 1 in the Coverage Test box (you can simply leave the default value) and press the Execute Coverage Test button. The test results will be shown below the Coverage Test box. Then enter 2 in the Coverage Test box and press the button again.
-
Since the inetinfo.exe process (the process of IIS) runs as a service, it will not end when you stop profiling. As a result, you should use the Run > Get Results menu itemthe AQTime > Get Results menu itemthe AQTime > Get Results menu item to obtain profiling results. Select this item or press Ctrl-R to get profiling results for the Coverage profiler.
-
Test results on the routines included in profiling will be displayed in the Report panel.
-
We received the following results of the tests in the application itself:

-
Stop profiling by pressing
 Terminate on the Standard toolbar.Stop profiling by selecting Terminate from Visual Studio’s AQTime menu.Stop profiling by selecting AQTime > Terminate from the main menu of RAD Studio.
-
-
Perform these steps for the Performance profiler.
-
Close the web browser.
 Prev
Prev