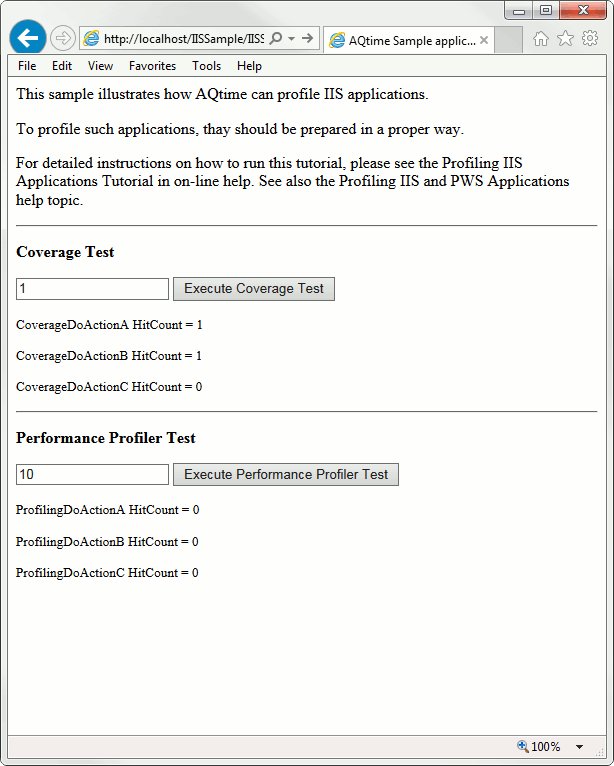
Again, let’s take a look at the final results of our tests that were displayed in the sample application:

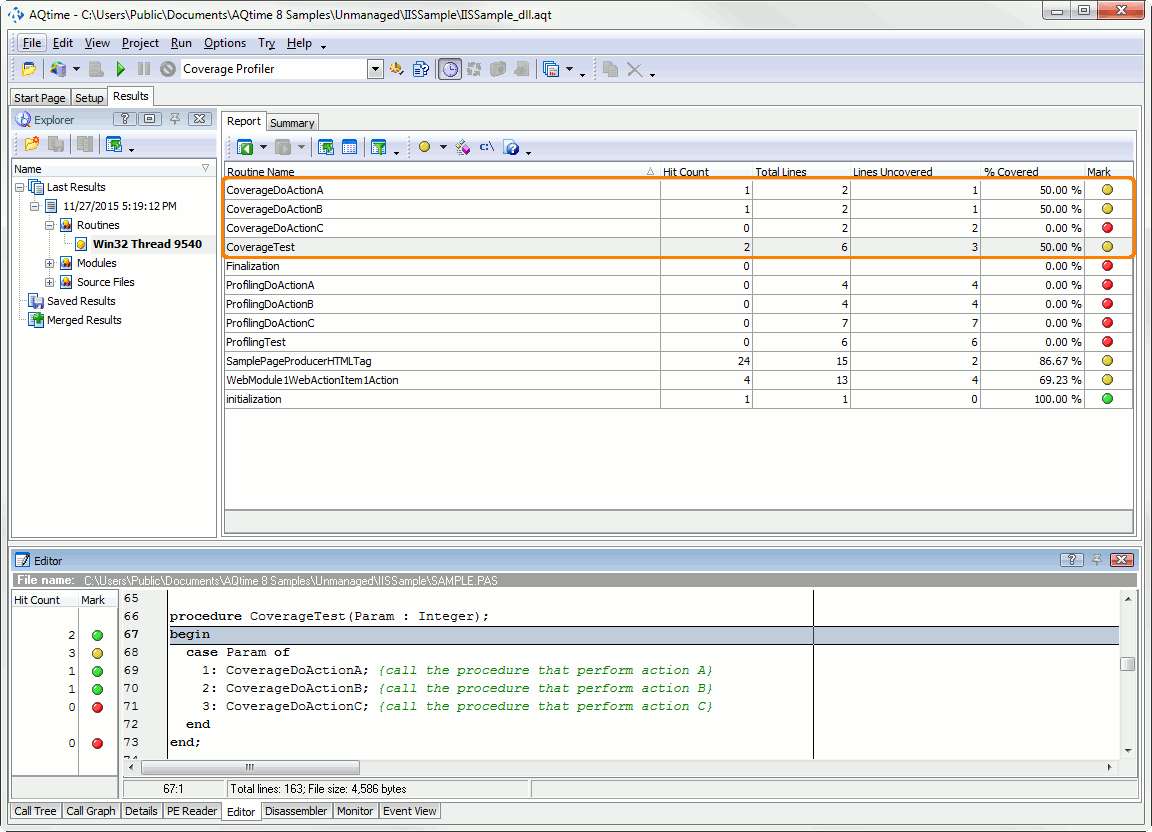
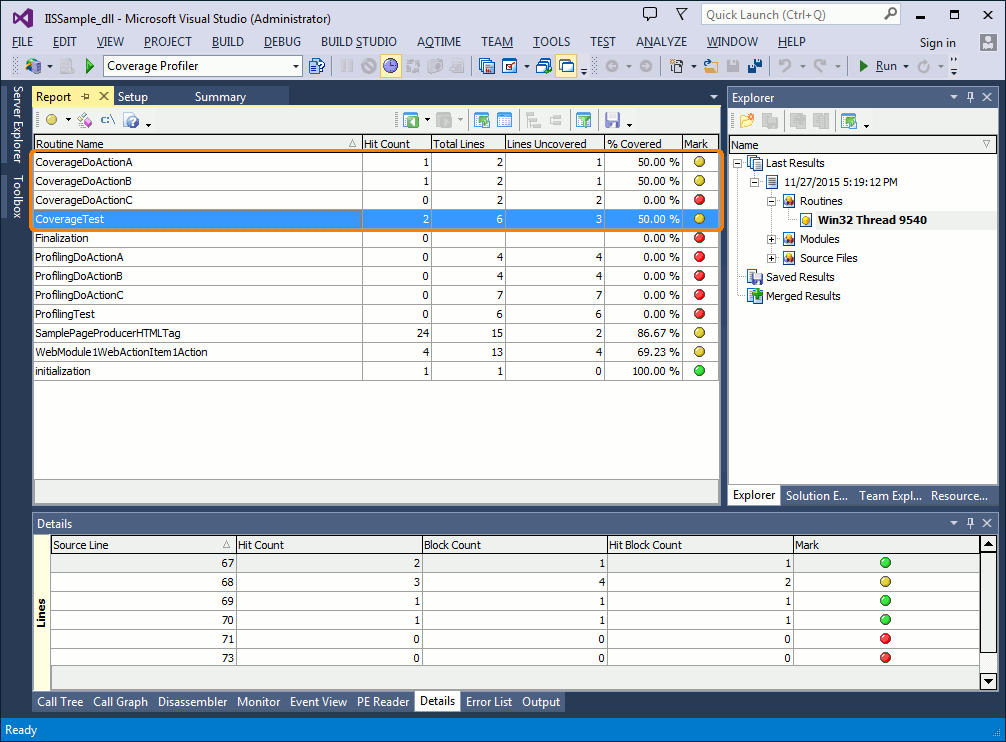
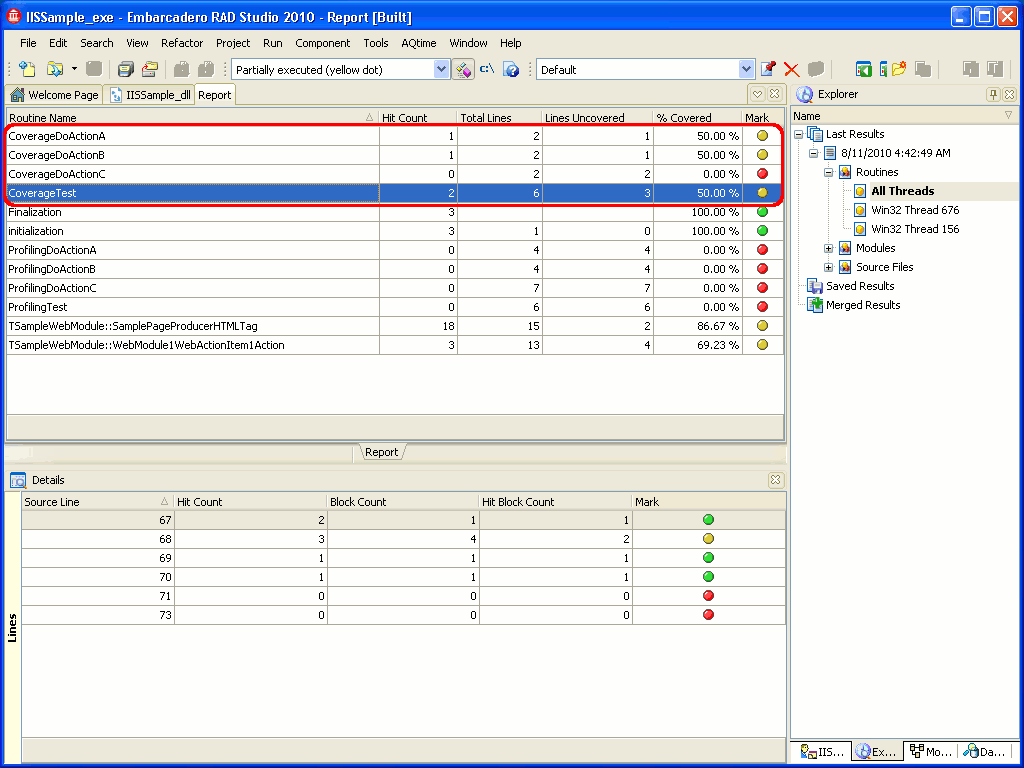
For comparison let’s open the results of the Coverage profiler:
You can see that the hit count results for the routines ProfilingDoActionA, ProfilingDoActionB and ProfilingDoActionC coincide in AQTime and in the web browser. For the Coverage profiler, this type of a check also gives you positive results. This confirms that when profiling IIS applications AQTime generates adequate results and displays them within its panels. Now you can work with the profiling results of IIS applications in the same way you do for regular (non-web) applications.


 Prev
Prev