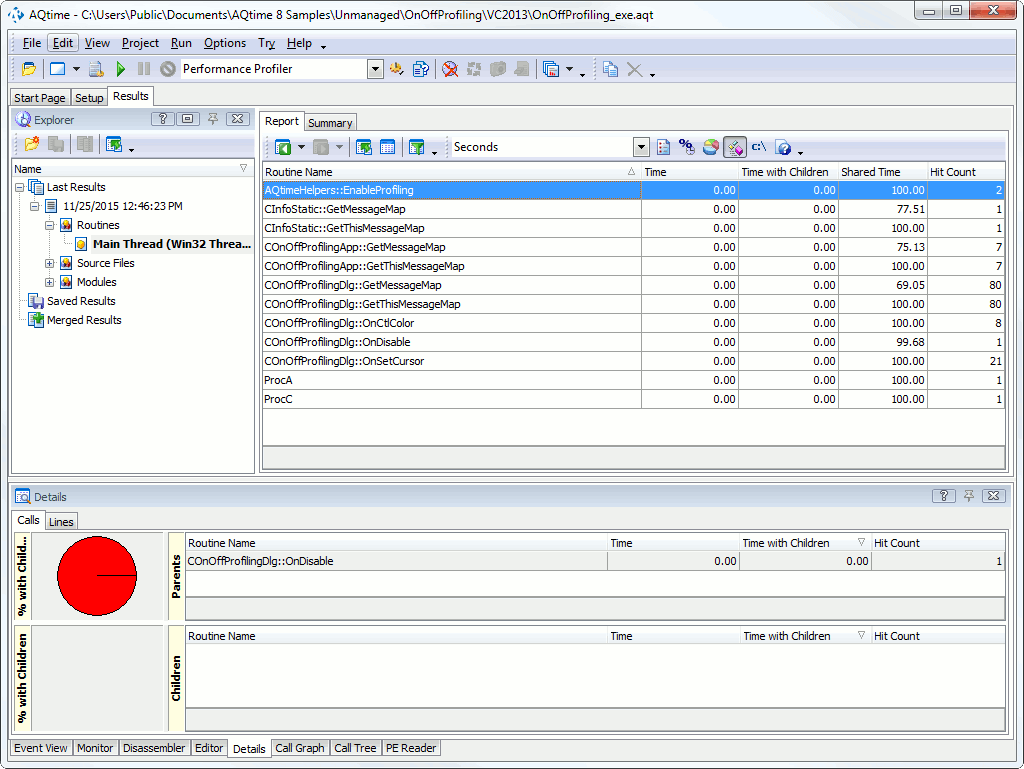
Take a look at the Report panel. It shows profiling results for all the routines that were executed during the profiler run (the figure shows the results of profiling of a sample Visual C++ application):
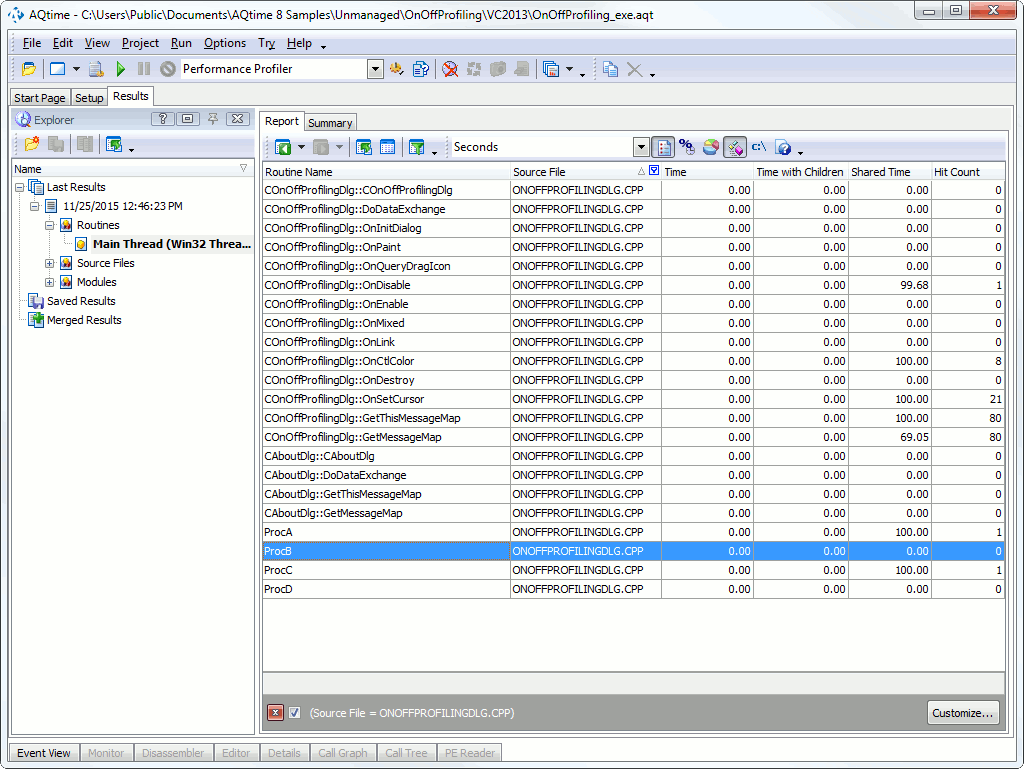
We are interested in routines that enabled and disabled profiling and in routines that were called from those routines. All these functions are kept in the OnOffProfilingDlg.cpp file. Let’s filter the contents of the Report panel in order to see only these routines. (Note that the file name depends on the sample that you profiled. For instance, if you use a Delphi sample the file name is Main.pas).
- Add the Source File column to the Report panel (see Adding and Removing Columns for more information on how to do this).
- Click the button in the caption of the Source File column and select the file name that corresponds to your sample (in our case, it is OnOffProfilingDlg.cpp) from the dropdown list. The file name may contain the path.
At the previous step, some routines of the OnOffProfilingDlg.cpp file were not profiled (ProcD and ProcB). By default, these routines are hidden in the Report panel. To make them visible, click  Show non-hit routines item on the Profiler toolbar. The Hit Count result of these routines is 0:
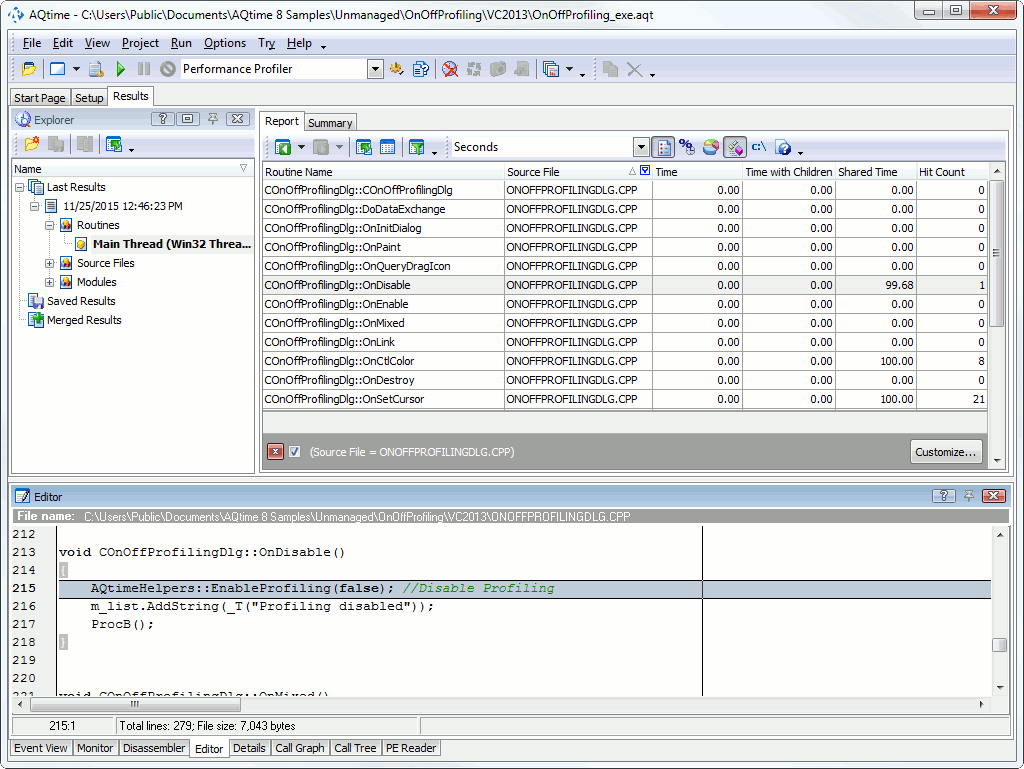
Let’s see why the ProcB and ProcD routines were excluded from profiling. To do this, switch to the Editor panel and explore the source code. Pay attention to the routines that are called upon pressing the Enable and Disable buttons in the application. The names of these routines depend on the sample application you use. In the Visual C++ example they are called OnEnable and OnDisable. We will use these names to refer to the routines.
AQTime reports that the OnEnable routine was not executed. This happens because the program calls this routine while the profiling is disabled. Therefore, AQTime does not profile this routine. The first line of the OnDisable routine disables profiling. So, AQTime profiles only a part of this routine. For instance, it does not profile the third line when the ProcB routine is called.
If you want to profile a routine, you should call EnableProfiling(true) before and EnableProfiling(false) after you call this routine. Do not call EnableProfiling within the routine you wish to profile, since you may get incorrect profiling results.


 Prev
Prev