
To illustrate how you can control profiling from the application that is being profiled, we will use a sample application shipped with AQTime, OnOffProfiling.
 <AQTime Samples>\Unmanaged\OnOffProfiling\VC2005 - Microsoft Visual C++ (Visual Studio 2005 project)
<AQTime Samples>\Unmanaged\OnOffProfiling\VC2013 - Microsoft Visual C++ (Visual Studio 2013 project)
<AQTime Samples>\Unmanaged\OnOffProfiling\Delphi - Borland Delphi
<AQTime Samples>\Unmanaged\OnOffProfiling\BCB - Borland C++Builder
| Note: | You can also open Visual Studio samples in later versions of Visual Studio. |
 |
On Windows Vista and later, AQTime samples are located in the <Users>\Public\Documents\AQTime 8 Samples folder. On other operating systems, the samples reside in the <Documents and Settings>\All Users\Documents\AQTime 8 Samples folder. |
-
Load the application in AQTime as a project.
-
Select All Project Modules (Routines only) in the Setup panel.
-
Choose the Performance profiler.
-
Make sure the
 Enable/Disable Profiling button is not pressed (that is, it looks like , not
  ), so that AQTime will not start profiling at startup.
 -
Press
 Run to start profiling. Select AQTime > Run to start profiling. Also you can start profiling if you press Visual Studio’s
  Run button while any of AQTime panels is active.Select AQTime > Run With Profiling to start profiling. AQTime will launch the sample program.
 -
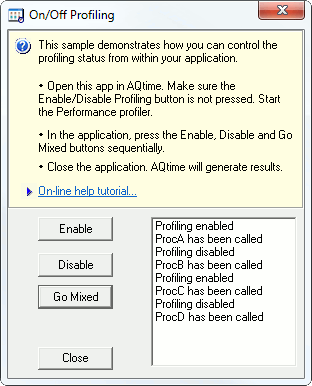
In the sample program, press the Enable, Disable and Go Mixed buttons sequentially.
-
The list box contains a list of executed routines and profiling states.
-
You can see that four routines (
ProcA,ProcB,ProcC,ProcD) were executed during our test. Let’s see what AQTime tells us. -
Close the sample program.
In the next step we will analyze the profiling results.
 Prev
Prev