
WPF Browser applications (or XAML Browser applications, or XBAP) are a specific kind of application that are compiled into .xbap extensions and can be run in Internet Explorer. This topic explains how you can profile your WPF Browser applications with AQTime.
 1. Preparing the WPF Browser Application
1. Preparing the WPF Browser Application
In order for AQTime to be able to profile your WPF Browser application, you should specify the compiler settings:
-
Open your WPF Browser application in Visual Studio.
-
Right-click your project in the Solution Explorer and choose Properties from the context menu. This will open the project properties for editing.
-
Modify project settings to compile the application with debug information (see Compiler Settings for Microsoft Visual C# 2005 - 2017 and Compiler Settings for Microsoft Visual Basic 2005 - 2017).
-
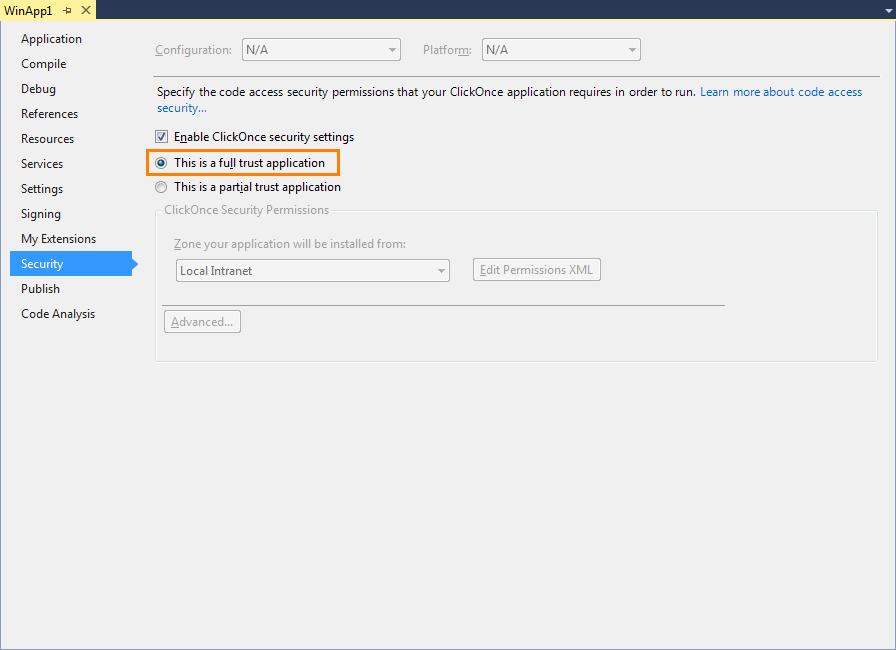
In the project properties editor, activate the Security tabbed page and select This is a full trust application:
-
Save the settings and re-build the application.
2. Preparing the AQTime Project
-
Launch AQTime and create a new empty AQTime project.
-
Select the
 Normal profiling mode on AQTime’s Standard toolbar.
Select the
Normal profiling mode on Visual Studio’s AQTime toolbar.Select the
Normal profiling mode on RAD Studio’s AQTime Profiling Modes toolbar. -
Choose Run > Parameters from AQTime’s main menu.Choose AQTime > Parameters from Visual Studio main menu.Choose AQTime > Parameters from RAD Studio menu. This will invoke the Run Parameters dialog.
-
Specify the following values in the dialog’s edit boxes:
Specify custom host application:
C:\Windows\System32\PresentationHost.exe
Parameters:-debug
Click OK to save the changes and to close the dialog.
-
Switch to AQTime’s Setup panel and add your application’s executable (.exe) to the AQTime project.
Typically, the .exe module resides in the <Application Folder>\Bin\Debug folder. However, if you published and launched your application, then it will be placed in the cache.
-
On Windows XP computers the cache is located here:
<Documents and Settings>\<USER_NAME>\Local Settings\Apps\2.0
-
On Windows Vista and later machines the cache is located here:
<Users>\<USER_NAME>\AppData\Local\Apps\2.0\
-
-
Now the project is ready for profiling. If needed, you can now create areas and tune triggers and actions.
3. Profiling
-
Start profiling in AQTime. AQTime will launch PresentationHost, which, in turn, starts your application.
-
Open Windows Explorer, go to the folder that contains the compiled version of your WPF Browser application and double-click the application (the .xbap file). This will launch the application.
-
Perform the desired actions over the application. AQTime will profile it.
-
To generate results, either close the application, or use the Get Results command.
AQTime will display profiling results in its panels.
| Tip: | There is another variant to launch an XBAP application from AQTime: when you modify the launch settings in the Run Parameters dialog, enter the following value into the Parameters box:
In this case, the .xbap application will be launched automatically when you start profiling. If the name or path of your .xbap module contains spaces, enclose the parameter in quotes, for instance:
|
See Also
Profiling Various Applications and Code
Profiling .NET Applications