
The actions you need to perform to profile the startup code of an application depends on whether the process is started by AQTime or by some other process or the operating system.
Regardless of the way your application starts, keep the following in mind:
-
Make sure the startup code is added to custom areas in the Setup panel.
-
The startup code may not contain the
retinstruction (this happens, for instance, with code of Delphi’s .DPR files), so to profile this code you may need to place it to the routine specially created for this. For more information, see Profiling Routines That Do Not Have the ret Instruction.
If the process is started under AQTime, the profiling engine traces the execution of all the application’s functions added to profiling tasks, so profiling the startup code is not a problem. You just need to add it to an including area (or areas).
If your process is not started by AQTime, but started by another process or by the operating system, then to profile it, you could attach AQTime to it (see Attaching to Process). However, attaching requires time, so most likely you will not be able to profile the startup code of your process.
Specifying the host process as a Host Application for the desired process in the Run Parameters dialog will not solve the problem as well. If you do so, AQTime will only profile the code that is executed within the address space of the host process, not the desired process. In other words, this approach works for dynamic link libraries or in-process COM servers, but does not work for applications.
To solve the problem, you can do any of the following:
-
Profile your application in COM Server profiling mode (you can do this even if the process to be profiled is not a COM server).
-
Modify the registry settings so that when the operating system gets a command to start a process, it automatically launches AQTime, which you can then use to profile your application.
Using COM Server Mode
When you select the COM Server profiling mode for the application, then AQTime automatically waits until the application’s executable is loaded in memory and then starts profiling the application code. COM Server mode was designed for profiling startup code of COM servers that are launched by the operating system. However, you can use this mode for profiling other applications, even if they are not COM servers:
-
Open your project in AQTime and add the startup code routines to custom areas (see Setting Up a Profiling Project).
-
Select
 COM Server from the Profiling Mode dropdown list box that is displayed on AQTime’s Standard toolbar.Select COM Server from the Profiling Mode dropdown list box that is displayed on Visual Studio’s AQTime toolbar.Click the COM Server button on RAD Studio’s AQTime Profiling Modes toolbar.
 -
Select Run > Parameters from AQTime’s main menu.Select AQTime > Parameters from Visual Studio’s menu.Select AQTime > Parameters from RAD Studio’s main menu. This will open the Run Parameters Dialog (for COM Server Mode). In the dialog:
-
In the Client Application box, specify the fully qualified name of the executable that will launch your application.
-
Press OK to close the dialog.
-
-
Press
 Run to start profiling. Select AQTime > Run (or select Debug > Run while one of AQTime panels is active) to start profiling.Select AQTime > Run With Profiling to start profiling. AQTime will display a message informing you that the client application should be run.
 -
Perform actions that will lead to launching your application.
-
Work with your application as needed.
-
Close your application and the application that was specified in the Client Application box of the Run Parameters dialog.
Modifying Registry Settings
To modify the registry settings:
-
Launch the Registry Editor (regedit).
-
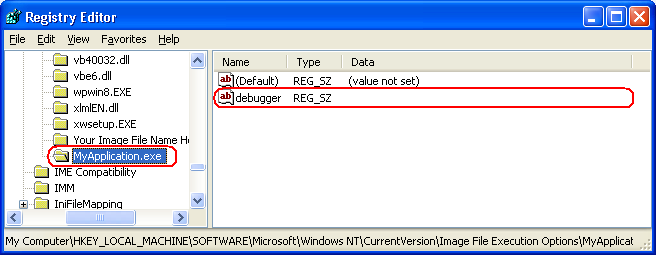
Open the HKEY_LOCAL_MACHINE\Software\Microsoft\Windows NT\CurrentVersion\Image File Execution Options node.
-
Add a key for your application to this node:
-
Right-click the node and choose New > Key from the context menu. This will create a new key node under the Image File Execution Options node.
-
Right-click the new node and select Rename from the context menu.
Change the key name to the name of your executable (for instance, MyApplication.exe). Only specify the file name and extension. The path is not needed.
-
-
Specify AQTime as a debugger for the application. To do this:
-
Right-click the new key node and select New > String Value from the context menu. This will append a new string value to the created key.
-
Switch to the right panel of the Registry Editor, right-click the string value’s node and choose Rename from the context menu.
In the ensuing in-place editor, change the value name to debugger.
-
Right-click the value node again and select Modify from the context menu. This will call the Edit String dialog.
-
In the Value data box of the dialog, enter the fully qualified name of AQTime.exe, for instance, C:\Program Files\SmartBear\AQTime 8\Bin\AQTime.exe.
-
Click OK to save the changes and to close the dialog.
-
Now the operating system will launch AQTime every time your application starts. The general profiling procedure is:
-
Run the application that will launch your application.
-
Modify the registry settings as it was described above.
-
Perform the actions that will lead to launching your application. The operating system will start AQTime as the registry settings specify it as a debugger for your application.
-
In AQTime, specify the areas and triggers, start profiling and profile your application as you normally would.
-
Close your application and explore profiling results in AQTime.
Do not forget to remove the key from the Registry when the automatic launch of AQTime is no longer needed.
If you need to enable or disable the automatic launch frequently, you can create two .reg files:
-
One of the files will include the Registry key and the debugger value with the path to AQTime:
To create this file:
-
Modify the registry as it was described above.
-
Select the key in the tree view on the left of the Registry Editor.
-
Choose File > Export from the editor’s main menu and specify the file name in the ensuing Export Registry File dialog.
-
-
Another file will store the Registry key and the debugger value, but it will not store the path to AQTime:
To create this file:
-
Modify the registry as it was described above.
-
Clear the data of the debugger value.
-
Export the key to a file by choosing File > Export from the main menu of the Registry Editor.
-
Now, when you need to enable or disable the automatic launch of AQTime for your application, you can execute one of the .reg files.
See Also
Profiling Various Applications and Code
Profiling Routines That Do Not Have the ret Instruction