
COM+ is the next generation of Microsoft’s Component Object Model (COM). It is built on the basis of COM and MTS (Microsoft Transaction Server). This topic explains how to profile COM+ applications with AQTime.
 1. Preparing Application for Profiling
1. Preparing Application for Profiling
-
Compile your application with debug information. See How AQTime Profilers Use Metadata and Debug Information for detailed instructions on how to do this.
-
Register your COM+ application in the operating system:
-
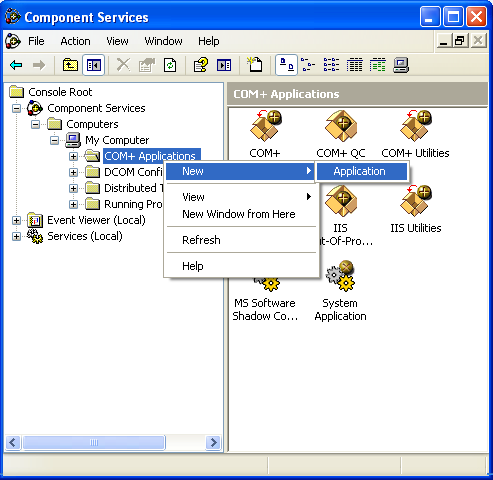
Open the Component Services dialog (Control Panel > Administrative Tools > Component Services).
-
Right-click the COM+ Applications item in the treelist on the left of the dialog. Select New > Application from the context menu. This will call the COM Application Install Wizard. Follow the steps of this wizard to create a COM+ application.
-
Once the application has been created, right-click the <Your app> > Components node and select New > Component from the context menu. This will call the Component Install Wizard. Use this wizard to add components to your application.
-
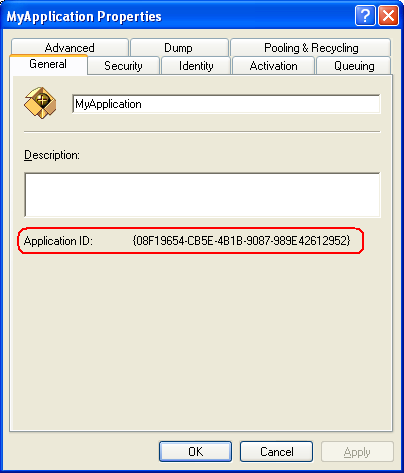
Right-click the application node in the treelist and select Properties from the context menu. This will call the Properties dialog:
-
Copy the Application ID field to the clipboard. You will need it for profiling.
-
2. Profiling Application
Once you have registered the application in the operating system, you can profile it. You can profile your COM+ application like other COM applications in two modes: Normal and COM Server. For information on difference between them, see Profiling COM Applications - Overview.
2.1. Profiling in Normal Mode
To profile your application in Normal mode, follow these steps:
-
Open your COM+ server in AQTime.
-
Specify areas, triggers and actions (see Controlling What to Profile).
-
Select the desired profiler.
-
Select
 Normal from the Profiling Mode dropdown list box that is displayed on AQTime’s Standard toolbar.Select Normal from the Profiling Mode dropdown list box that is displayed on Visual Studio’s AQTime toolbar.Click the Normal button on RAD Studio’s AQTime Profiling Modes toolbar.
 -
Select Run > Parameters from AQTime’s main menu.Select AQTime > Parameters from Visual Studio’s main menu.Select AQTime > Parameters from RAD Studio’s main menu. This will call the Run Parameters Dialog (for Normal Mode).
-
In the dialog:
-
Specify dllhost.exe in the Specify custom host application edit box. By default, this executable is located in the <Windows>\System32 folder.
-
Paste the Application ID value to the Parameters edit box (You copied this value from the Properties dialog of your COM+ application).
-
Press OK to close the dialog.
-
-
Press
 Run to start profiling. Select AQTime > Run (or select Debug > Run while one of AQTime panels is active) to start profiling.Select AQTime > Run With Profiling to start profiling. The dllhost.exe application will create the COM+ server with the ID specified in its command line.
 -
Run the client application and perform profiling in the usual manner.

To obtain profiling results, select Run > Get Results from AQTime’s menu.select AQTime > Get Results from the main menu of Visual Studio.select AQTime > Get Results from RAD Studio’s main menu. -
To stop your COM+ server, either click
 Terminate on AQTime’s Standard toolbarselect AQTime > Terminate from the main menu of Visual Studioselect AQTime > Terminate from RAD Studio’s main menu or right-click the application node in Component Services and select Shut Down from the context menu. Note that Terminate and Shut Down call the Windows API
 TerminateProcessfunction. This function kills the process and does not send any notifications to AQTime. So, AQTime does not generate any profiling results. That is why you should select Get Results before terminating the server.
2.2 Profiling in COM Server Mode
To profile your application in COM Server mode, perform the following steps:
-
Select
 COM Server from the Profiling Mode dropdown list box that is displayed on AQTime’s Standard toolbar.Select COM Server from the Profiling Mode dropdown list box that is displayed on Visual Studio’s AQTime toolbar.Click the COM Server button on RAD Studio’s AQTime Profiling Modes toolbar.
 -
Select Run > Parameters from AQTime’s main menu.Select AQTime > Parameters from Visual Studio’s main menu.Select AQTime > Parameters from RAD Studio’s main menu. This will open the Run Parameters Dialog (for COM Server Mode). In the dialog:
-
In the Client Application box specify the name of the executable that will load COM+ server. This can be, for example, dllhost.exe located in the <Windows>\System32 folder.
-
Press OK to close the dialog.
-
-
Press
Run to start profiling.Select AQTime > Run to start profiling.Select AQTime > Run With Profiling to start profiling. AQTime will display a message box informing you that you should launch the client application. -
Run the client application and profile the application as you normally would.
To obtain profiling results, select Run > Get Results from AQTime’s menu.select AQTime > Get Results from Visual Studio’s menu.select AQTime > Get Results from RAD Studio’s main menu. -
To stop your COM+ server, either click
Terminate on AQTime’s Standard toolbareither select AQTime > Terminate from the main menu of Visual Studioeither select AQTime > Terminate from RAD Studio’s main menu or right-click the application node in Component Services and select Shut Down from the context menu.
See Also
Profiling COM Applications
Profiling COM Applications - Overview
Getting Results During Profiling