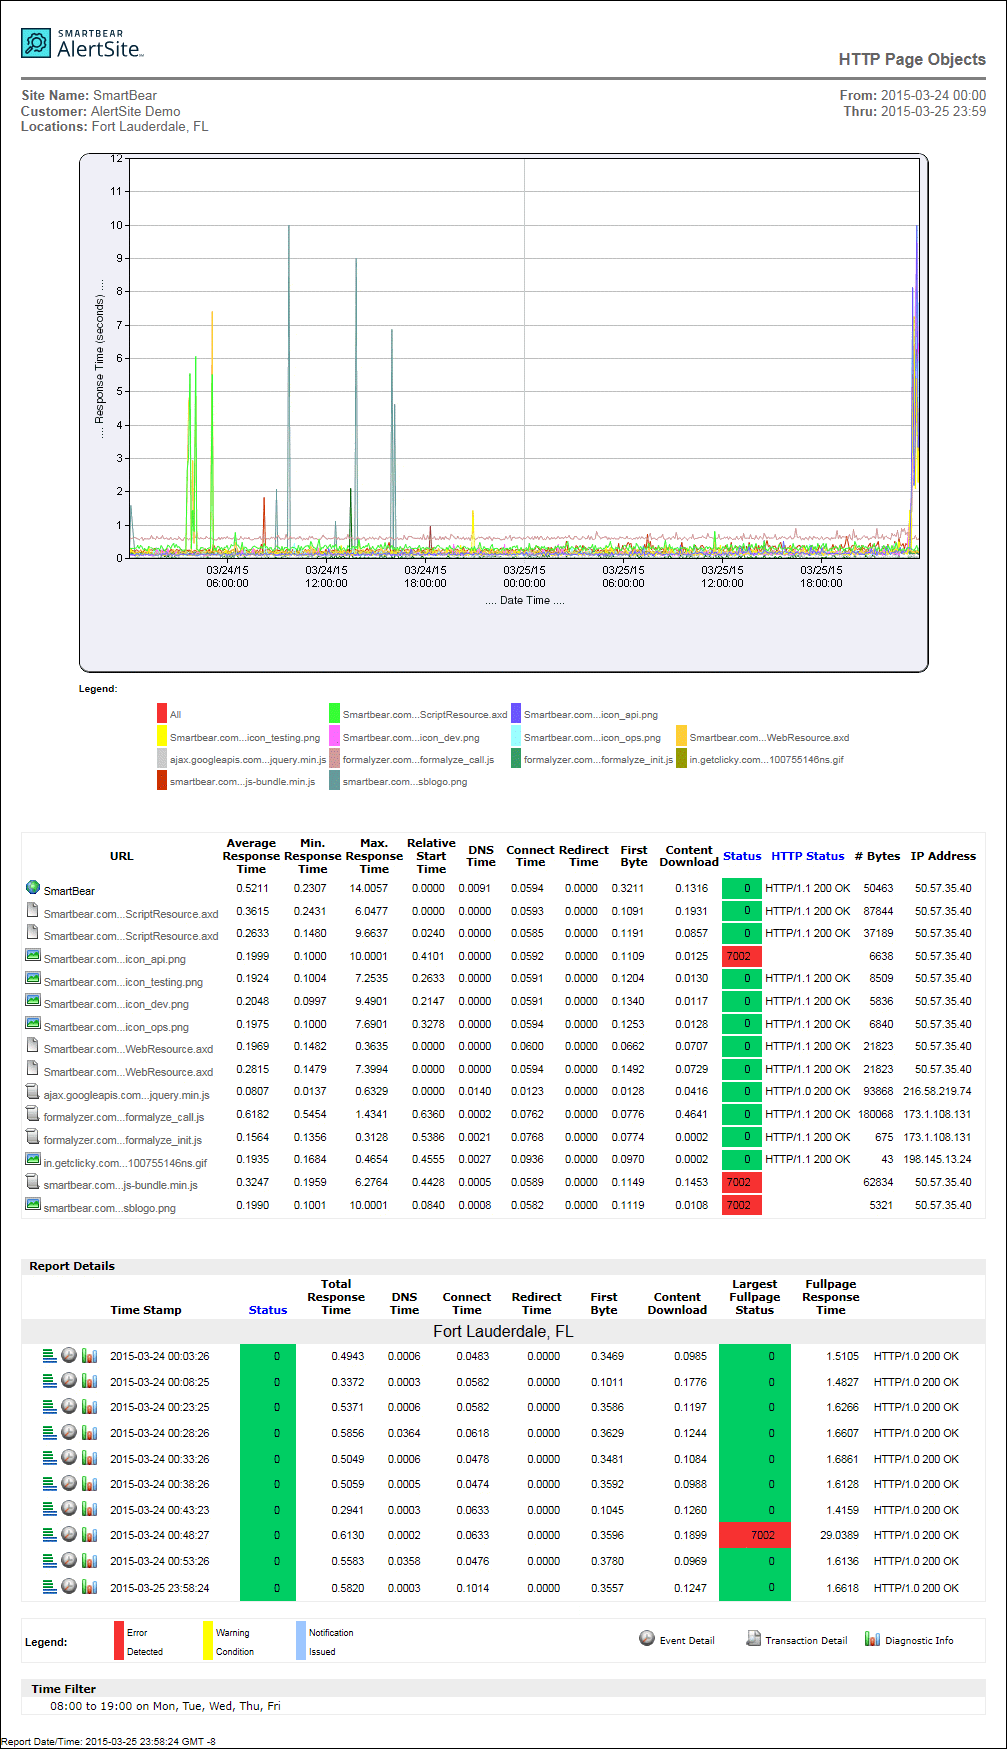
This report is for website and DéjàClick monitors with the fullpage monitoring enabled. It shows the average response time for each page resource – image, JavaScript file, and so on, over the selected period.
| Note: | For DéjàClick monitors, the report can include data for only one page (action) of the transaction. |
Report options
When creating the report, you can customize the report contents by using the following options (they are in the Report Options section):
-
Graphs – Includes a graph that shows the response time of each page resource – image, CSS file and so on. To view just a specific resource on the graph, click it in the legend or click All to view all resources.
-
Report Details – Includes a table with all monitor runs over the selected period. You can drill down into run details by clicking the icons next to the runs.
Report columns
For a description of the report columns, see Report Column Descriptions.

