
After running a test, you can view test results in TestComplete. If the Activate after test run option is enabled (default), TestComplete automatically displays the test log when the test run is over. In the Project Explorer, you can also open existing test logs.
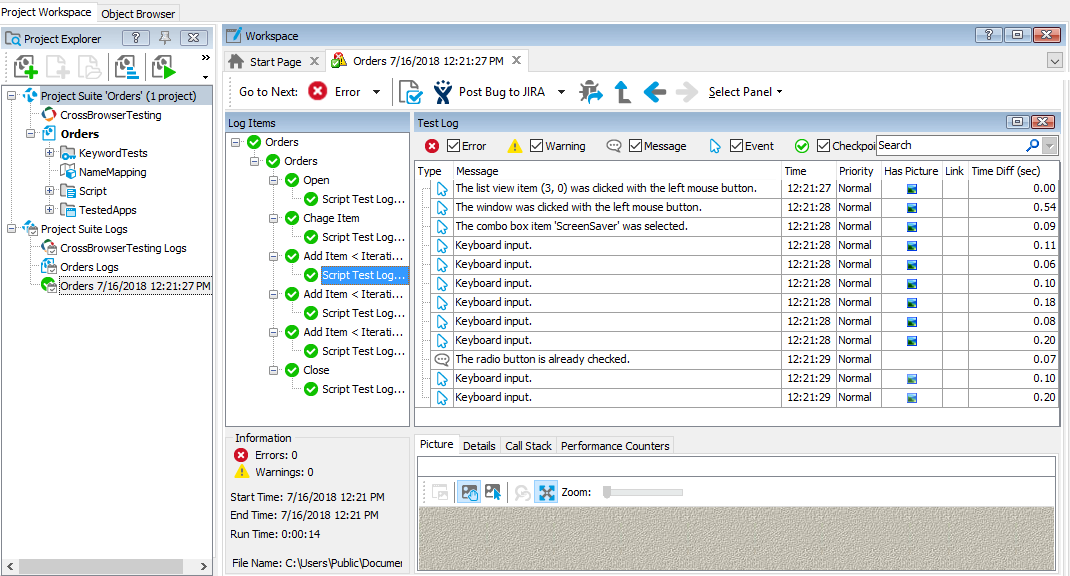
The log viewer consists of several panels. The left panel, Log Items, displays a tree-like structure of the test results, while the pages on the right display the results contained in the selected log item. The layout of pages that show the results depends on the test type. The most commonly used layout is the Generic Test Log that shows the results of keyword tests, script tests, unit tests and other tests.
The table below lists various log pages that show tests results in TestComplete:
| Log Pages | Description |
|---|---|
| Generic Test Log (or keyword test log, or script log) |
Shows the results of various tests: keyword tests, script routines, unit tests and others. The page contains the Test Log, Details, Picture and Call Stack panels. |
| Project Suite Log | Shows the results of a project suite. The page contains the Test Run Summary, Project Suite Log, Messages and Extended Messages panels. |
| Project Log | Shows the results of a test project. The page contains the Test Run Summary, Project Log, Messages and Extended Messages panels. |
| Network Suite Log | Shows the results of network suite runs. The page contains messages posted by network suite jobs and tasks to the log during the run. |
| MSTest Unit Test Log | Shows the results of MSTest unit tests. The log includes the MSTest Tests, MSTests Output and MSTest XML Log pages. To display the results of unit and Selenium tests of other types, TestComplete uses generic log pages. |
| XML Comparison Results Log | Shows comparison results for XML files. The pages contain the XML Comparison Results, Expected XML Data and Actual XML Data panels. |
| File Comparison Results Log | Shows comparison results for files. The log page contains the Baseline file and Checked file panels. |
Usually, all log panels are visible. If a panel is hidden:
-
Select it from the Select Panel drop-down list on the toolbar:

– or –
-
Right-click within the Log Items tree, click Select Log Panel, and then select the needed panel:

You can customize the layout of log panels. For example, you can sort the records by column, or dock and undock panels in the test log window. To enable or disable docking of log windows, use the Tools | Docking Allowed menu item.