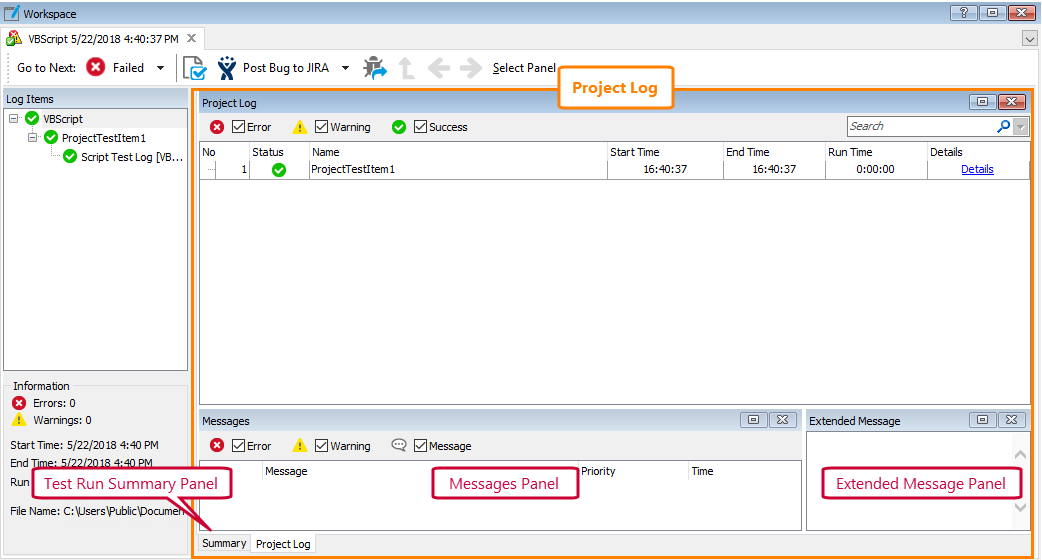
The log of a project run includes several panels. This topic describes them. The section also explains how you can work with panels.
Test Run Summary Panel
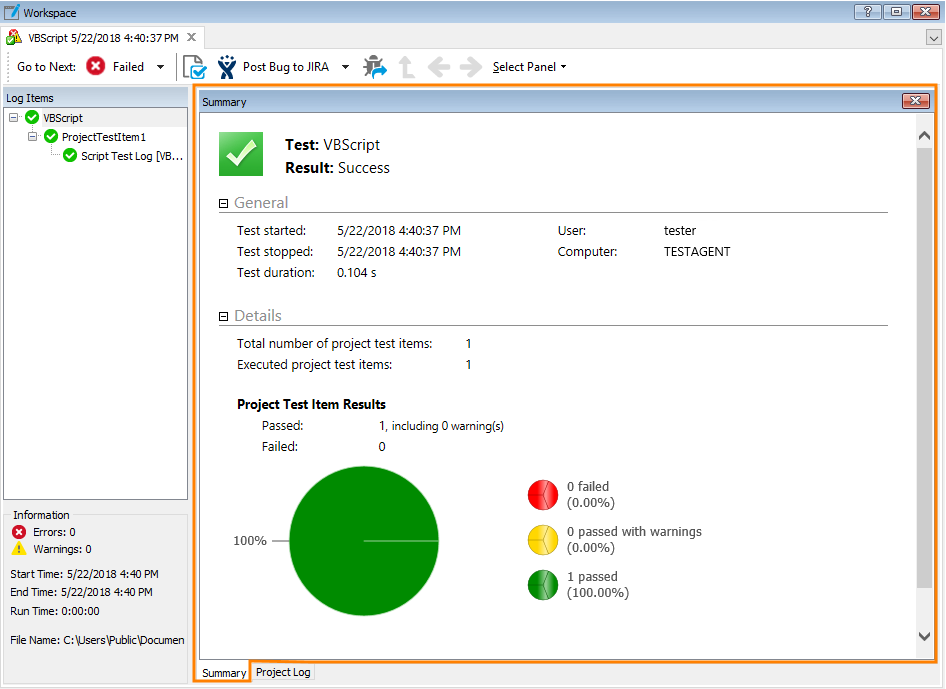
The Test Run Summary panel contains brief information on the project run. The project name and status (success, error, warning) are displayed at the top of the panel. The rest of the panel displays more detailed information on the run. All the contents are organized into two expandable sections: General and Details.
General Section
This section contains statistics on the project run time: the start time, end time and test duration. It also contains both the name of the computer and the user account that were used to run the project.
Details
This section contains the following values:
-
Total number of project test items - The total number of project test items specified on the Test Items page. This number includes both the test items that were executed during the project run and the test items that were excluded from testing.
-
Executed project test items - The total number of project test items which were executed during the project run. These test items of the project are marked as enabled on the Test Items page (the check box next to the item’s icon is selected). In the tree of the project run log, these items are displayed with the
 ,
,  and
and  icons.
If a test item is executed several times during the project run (that is, the Count column of the Test Items page specifies a number other than 1 for this item), the Total number of project test items and Executed project test items values calculate this item as many times as it was executed. -
Project Test Item Results - Shows the statistics for numbers of passed and failed test items.
-
A chart that visually represents statistics on errors and warnings. The chart displays the number and percentage of test items that were executed successfully, as well as the number and percentage of test items that failed to be executed or were executed with warnings.
The View detailed results link jumps to the Project Log panel (that is, the root panel for the result analysis). For more information on this panel, see below.
Project Log Panel
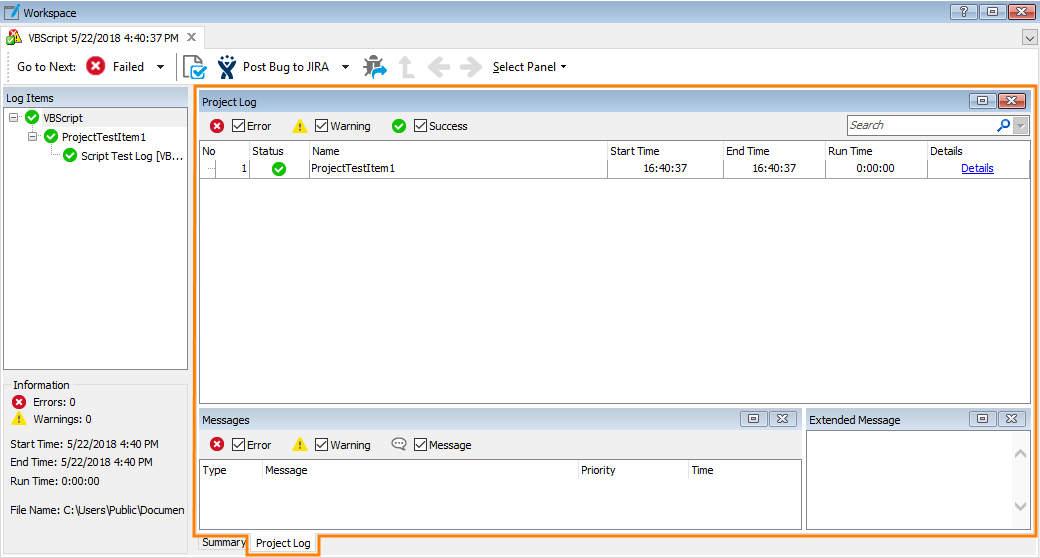
The Project Log panel contains information about the test items executed during the project run. Each record in the log corresponds to a test item:
The Project Log panel has the following columns:
| Column | Description |
|---|---|
| No | The number that indicates the test run chronologically. The oldest test is indicated by the number 1. |
| Status |
Specifies the result of the test:
|
| Name | The name of the test item that was executed. |
| Start Time | The date and time when the test execution started. |
| End Time | The date and time when the test execution finished. |
| Run Time | Specifies the duration of the test run. |
| Details | Holds a hyperlink that leads you to the detailed results of the test run. |
Messages Panel
The messages posted to the log during the test item execution are shown in the Messages panel.
This panel contains the following columns:
| Column | Description | ||||||
|---|---|---|---|---|---|---|---|
| Type | Type of the message:
|
||||||
| Message | Message text. | ||||||
| Priority | The message’s priority. Priority is one of the parameters for logging messages. It sets the default background color, font color and font style for the message. Priority is an integer value. The following values are predefined priorities:
100 - Lowest For these predefined priorities, the column displays string constants rather than numeric values. If a message has a priority other than 100, 200, 300, 400 or 500, the priority is displayed as a numeric value, without the name. |
||||||
| Time | Time when the message was logged. |
Extended Message Panel
The Extended Message panel contains additional information for the message selected in the Messages panel.
Working With Panels of the Project Log
The column layout in the Project Log and Messages panels are not strictly defined. You can arrange columns using the customization capabilities provided by TestComplete. For instance, you can sort records on a column or hide or display some columns. For more information on this, see Arranging Columns, Lines and Panels.
By selecting or unselecting the check boxes at the top of the panels, you can easily filter the log contents so that the panel displays messages of the selected type. For instance, by selecting the Error check box and unselecting other check boxes, you can command the panel to display only the error messages. For instance, the following figure displays the Project Log panel showing only the error messages:
In addition, TestComplete provides you with the Quick Filter feature that simplifies finding certain messages. The log contents will be filtered out according to the text that you are typing in the Quick Search edit box. The search is performed in all string columns of the Project Suite Log panel. To remove the filter, erase the text you have typed, or just press the  button.
To get detailed information on the test log structure and how to work with test results, see About Test Log.


 Test Run Summary Panel

