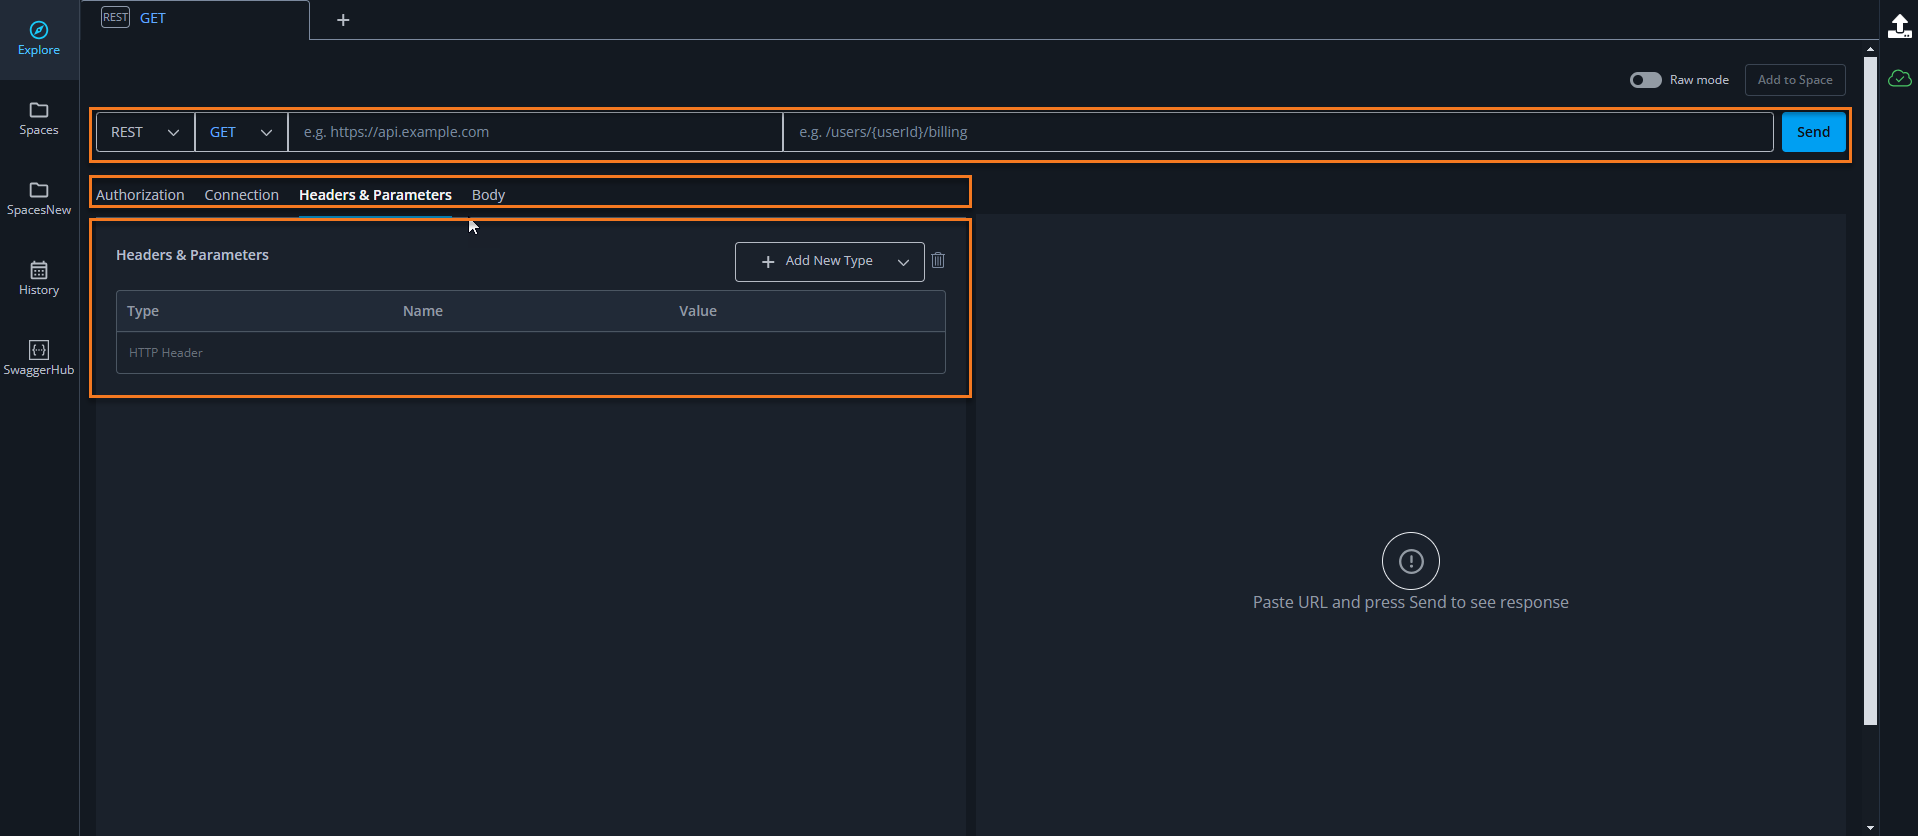
Overview of Main Screen
This topic describes the layout and controls of SwaggerHub Explore's main screen.
When you open SwaggerHub Explore, you see the following icons on the left toolbar:
Explore. This is the main SwaggerHub Explore page. This is your main work area, and it displays tabs for each of your current operations.
Spaces. You can group API operations into collections, like folders of bookmarks. For more information, see Save Operations in Spaces.
History. This lists a log of 1000 previous operations in descending order by date.
SwaggerHub. Choose APIs from SwaggerHub to work on in SwaggerHub Explore.
Organization. The section where you can manage your organization.
Across the top of the screen are tabs, like standard web browser tabs. All tabs are closed when you exit SwaggerHub Explore. You can retrieve previous tab contents and re-run operations from the History log.
The main screen (the Explore tab) also includes the following areas:
Operation Details. Specify the settings for this connection. This section includes:
Protocol. Kafka or REST.
Operation. For REST the operations are GET, PUT, POST, DELETE, OPTIONS or PATCH. For Kafka the operations are publish or subscribe.
Authorization. Specify authorization credentials if required.
Connection. Configure connections settings for the API interactions, such as connection timeout.
Headers & Parameters. Specify parameter values to be used in this operation.
Body. Enter text to be sent in the body of the operation.
Server and Path. Enter the URL into the Server field. SwaggerHub Explore automatically adds http:// if it is not already included and moves the path portion of the URL into the Path field.
Settings display area. By default, the Headers & Parameters values are displayed in the settings display area. When you click on other settings, this area will change to display the chosen settings.
Response. When you click Send, the response displays here.
 |
You can also click next to the SwaggerHub Explore logo to see other API Hub products.
Next Steps
To learn more about SwaggerHub Explore see the following topics: