You use soak testing to find issues that come up during extended work with the server, like server memory leaks.
Ideally, at the end of a test run, the server performance should be the same as it was at the beginning of the test. The decrease in performance can indicate that the server code has some issues.
Test Parameters
To create baseline tests, we recommend using the Baseline load test template. By default, it will create a test with the following parameters:
| Parameter | Value |
|---|---|
| Duration | 24 hours |
| Load type | VUs |
| Simulated load | Fixed, 50 virtual users (25 for trial users) |
| Wait time | One second (100 ms for trial users) |
| Warmup time | 15 seconds |
| Assertions |
Time taken – Average; Time taken – Max; Assertion failures – Per Second; |
As an option, you can configure server monitors.
ReadyAPI will create two statistics charts, one for the load test and another for the server monitors.
Alternatively, you can create a load test with similar parameters manually.
Sample Test Results
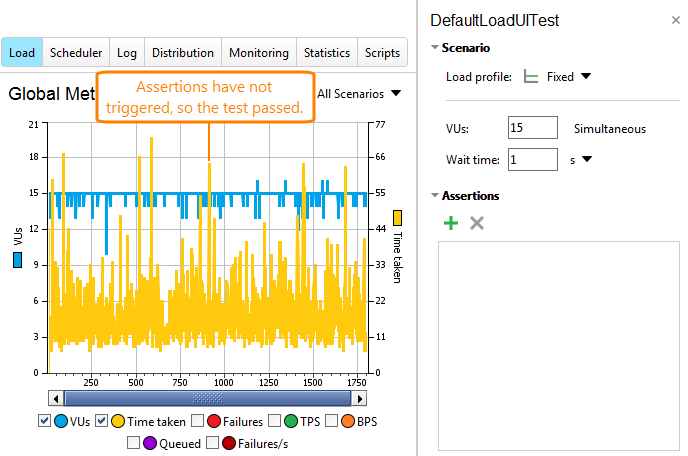
Here is what the first 30 minutes of your test may look like:
Assertions and Server Metrics
To estimate the server performance, you can track various server-side metrics or use assertions.
Server Metrics
With ReadyAPI, you can track various server-side metrics like memory and CPU usage, the number of database requests per second, and so on. To do this, you need to configure server monitors in your load tests. For detailed information, see the topics of the Server Monitoring section.
You can check metric data on the Server Monitoring and Statistics pages of the load test inspector.
The exact metrics to be checked depend on your server type and on the type of your server applications. For information on the available metrics, see Monitor Reference.
Assertions
You can try using the following assertions:
| Assertions | Description |
|---|---|
| Test Target – Time Taken | Lets you control the request simulation time. (Memory leaks typically lead to slowdowns.) The Time Taken assertion on the Test Steps page will help you check if a certain test step takes too long to be executed. |
| Test Steps – <Test Step Name> – Time Taken | |
| Load Test – Failures – Total | Lets you check the total number of errors that occur during the test run. |
| Test Target – Failures – Total | |
| Test Steps – <Test Step Name> – Failed |
Example
Let's suppose that the expected load for your server is 10 users, and the simulated test case lasts for 10 seconds.
If you use the VUs load type, set it up so that 12 users are simulated. If the server starts to slow down, ReadyAPI Performance will keep 10 users working with the server, but the target test case will take longer to run. You will be able to see it on the graph – the Time Taken metric will increase.
If you use the Rate load type, set it up so that a user arrives to the server each second. For the first hour, this test will simulate 10 users on the average. If server responses slow down, you will notice the user build-up on the server. If the server slows down by 50%, there will be about 50% more users working with it. This will create more test cases and the server will slow down much faster than in the situation when you are using the VUs load type.
See Also
Fixed Profile
2. Load Test Editor Interface Overview
ReadyAPI Performance Licenses

