After you close the sample application, AQTime generates profiling results and displays them in its panels.
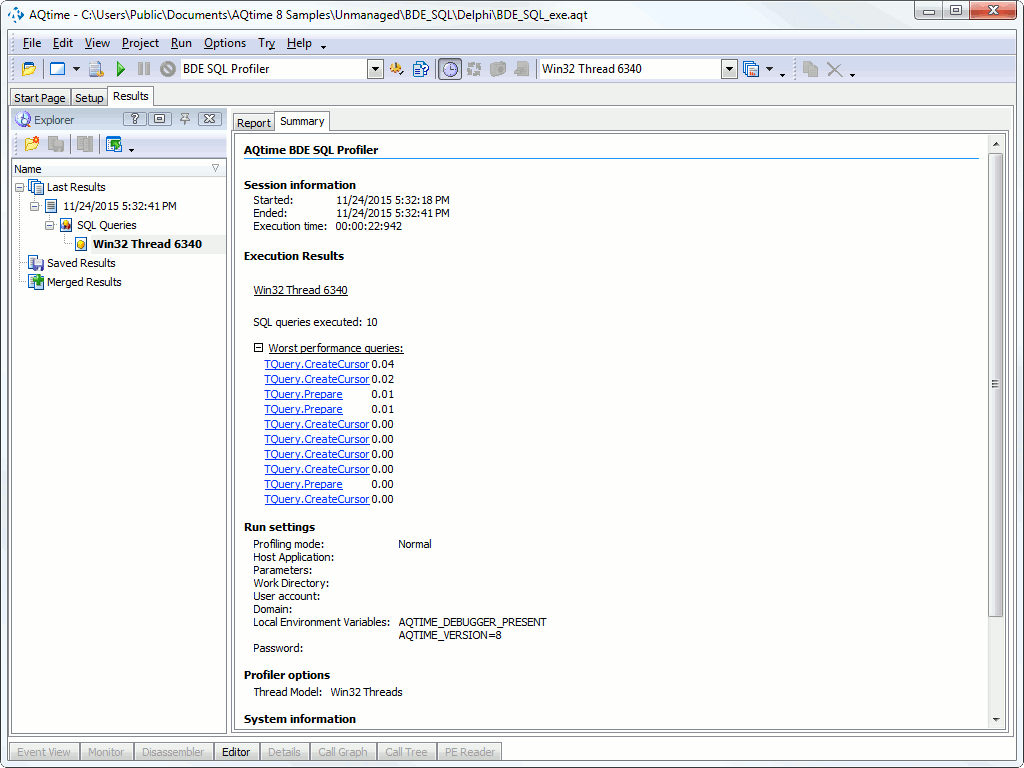
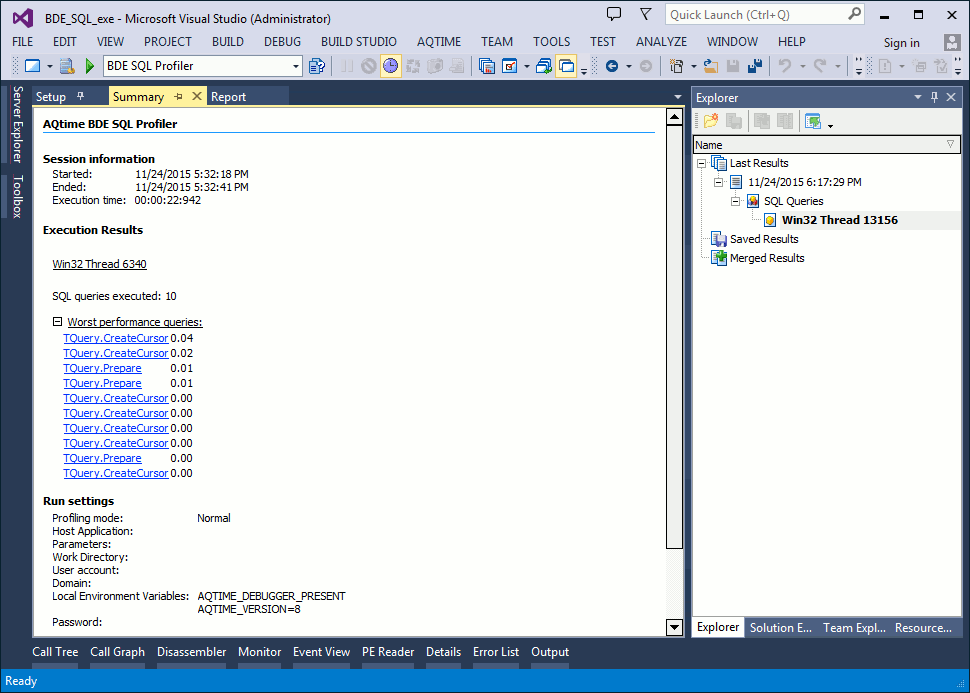
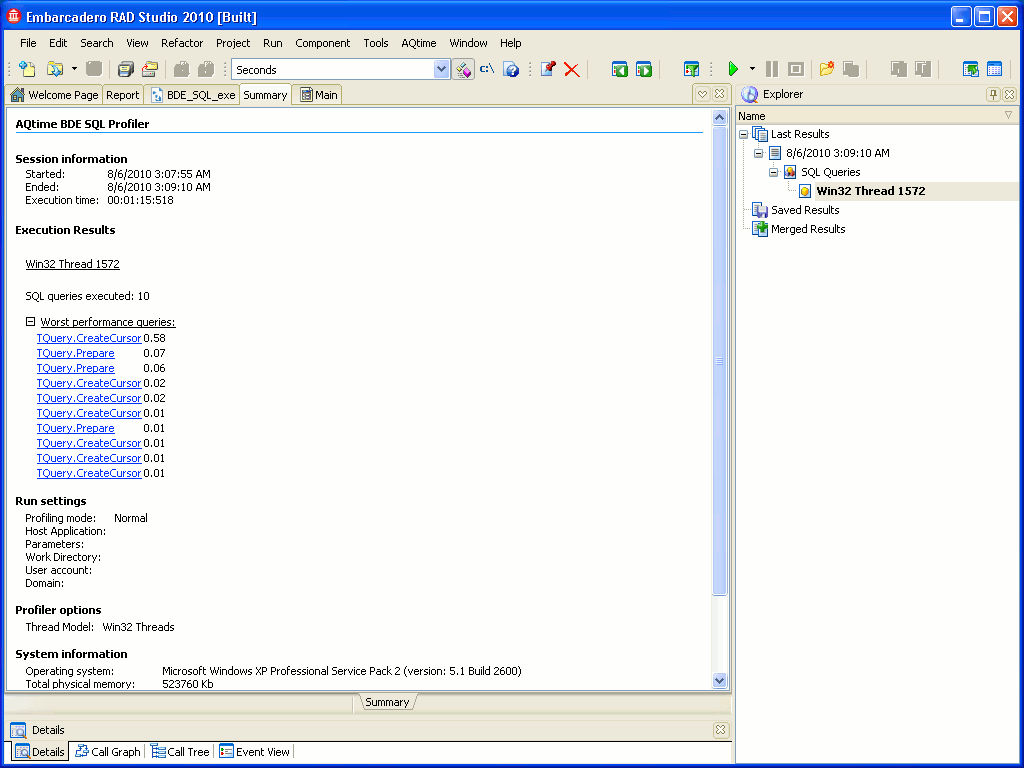
The Summary panel contains brief profiling results. It shows the start time, finish time and the total profiling time, the total number of executed SQL queries, a list of the worst performing queries and some system information.
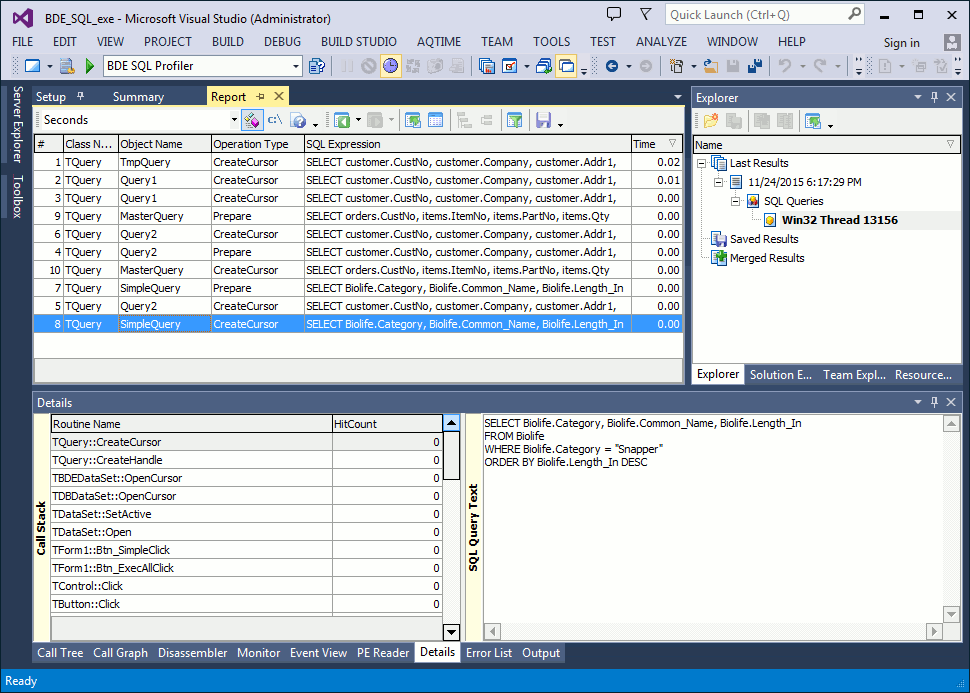
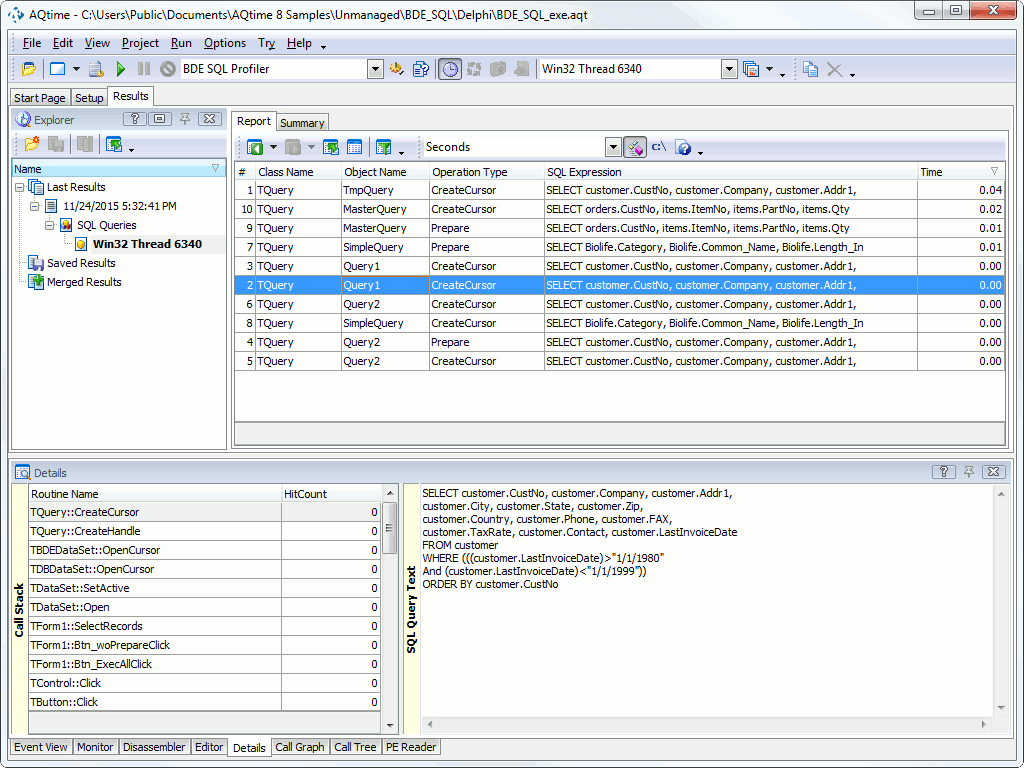
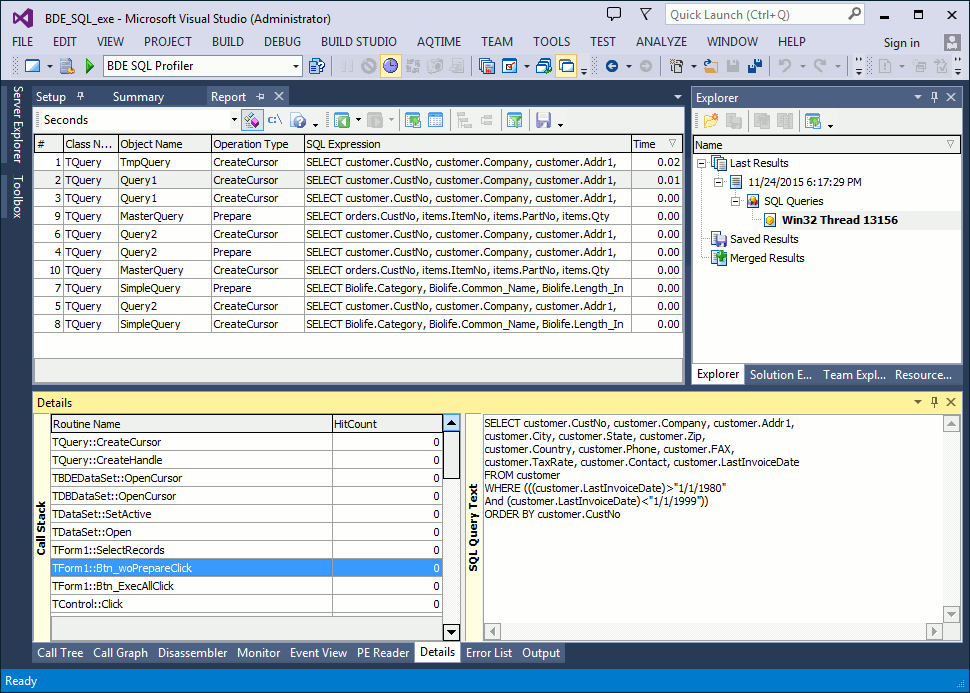
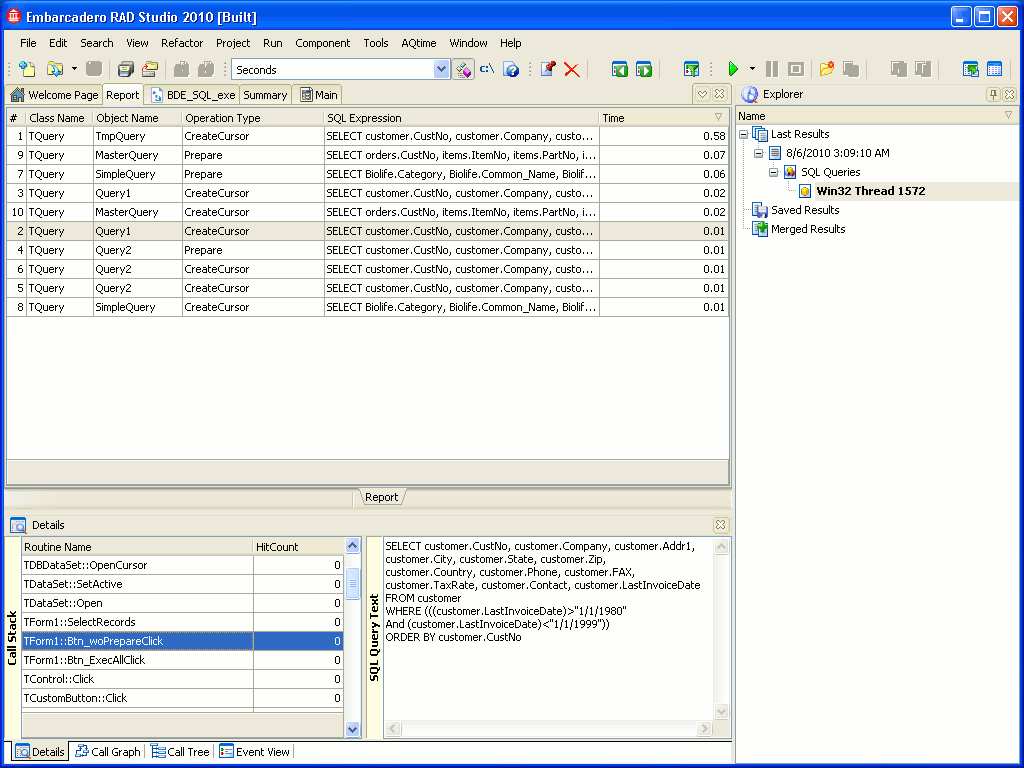
Information on individual SQL queries is displayed in the Report panel.
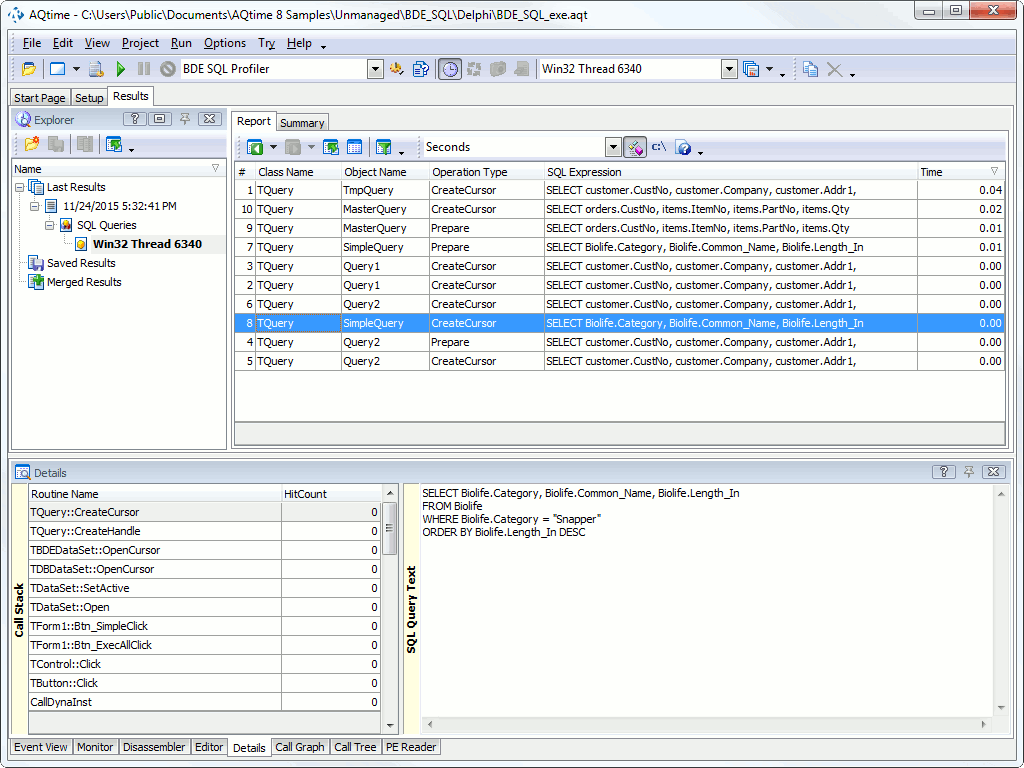
Each row of the Report panel contains information about the execution of the ExecSQL, ExecProc or Prepare method: the class name, the name and execution time of the query or stored procedure and SQL expression. For complete information on the Report panel columns, see BDE SQL Profiler - Report Panel Columns.
Each row in the Report panel corresponds to a single SQL query in your application. You can select a query in the Report panel and see the information about that query in the Details panel.
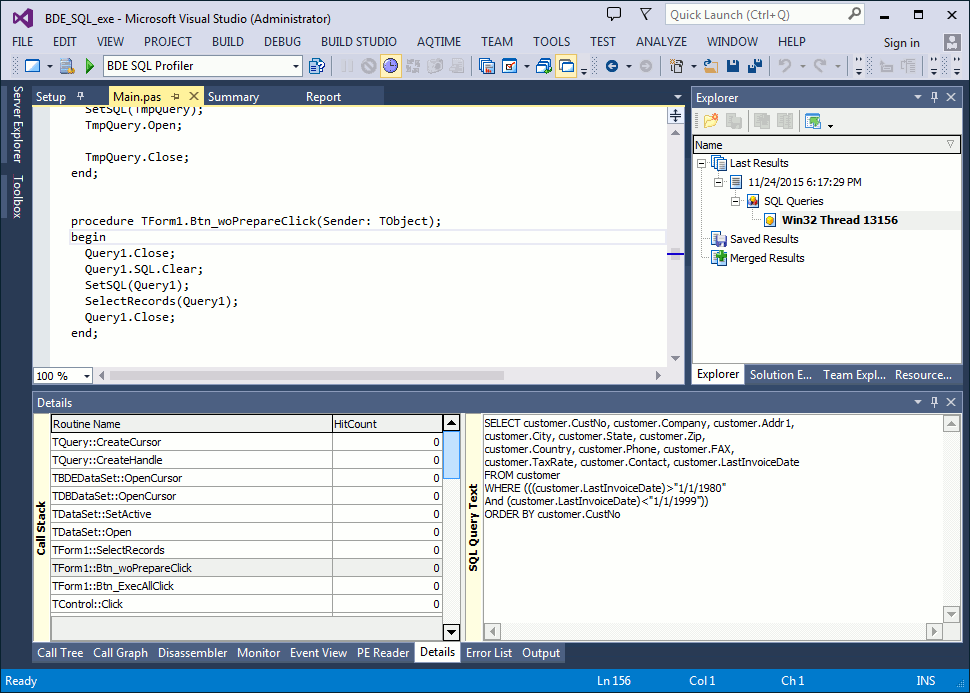
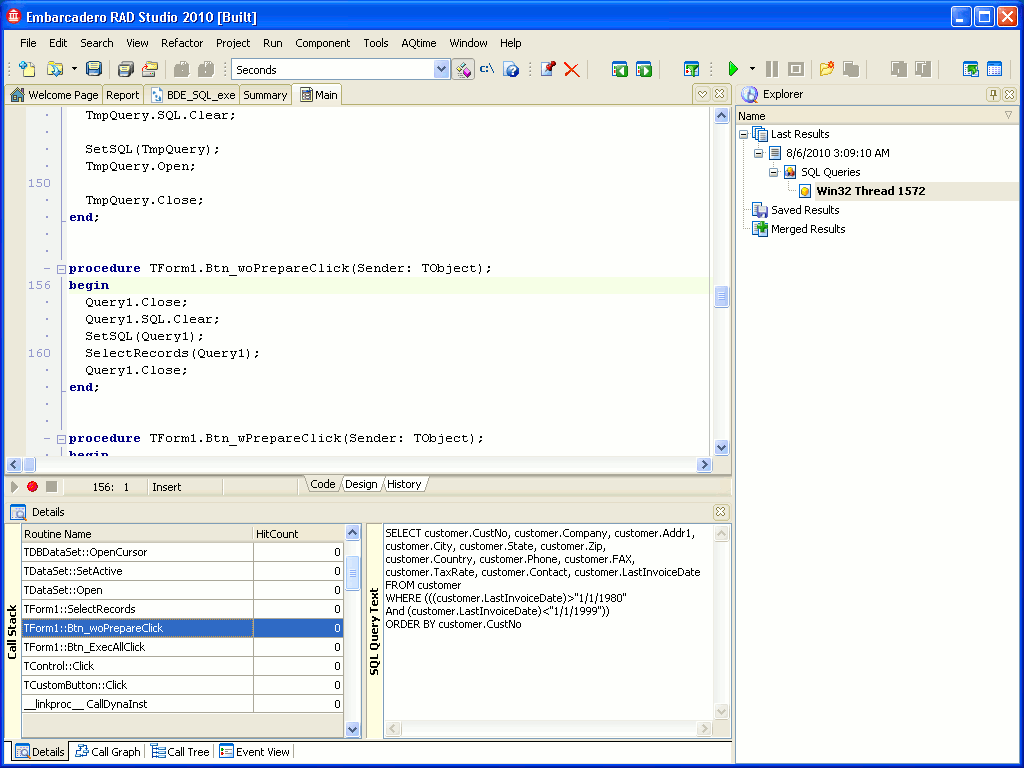
The Details panel contains the Call Stack pane that displays a sequence of functions that call the BDE operation currently selected in the Report panel and the pane that shows the executed SQL expression.
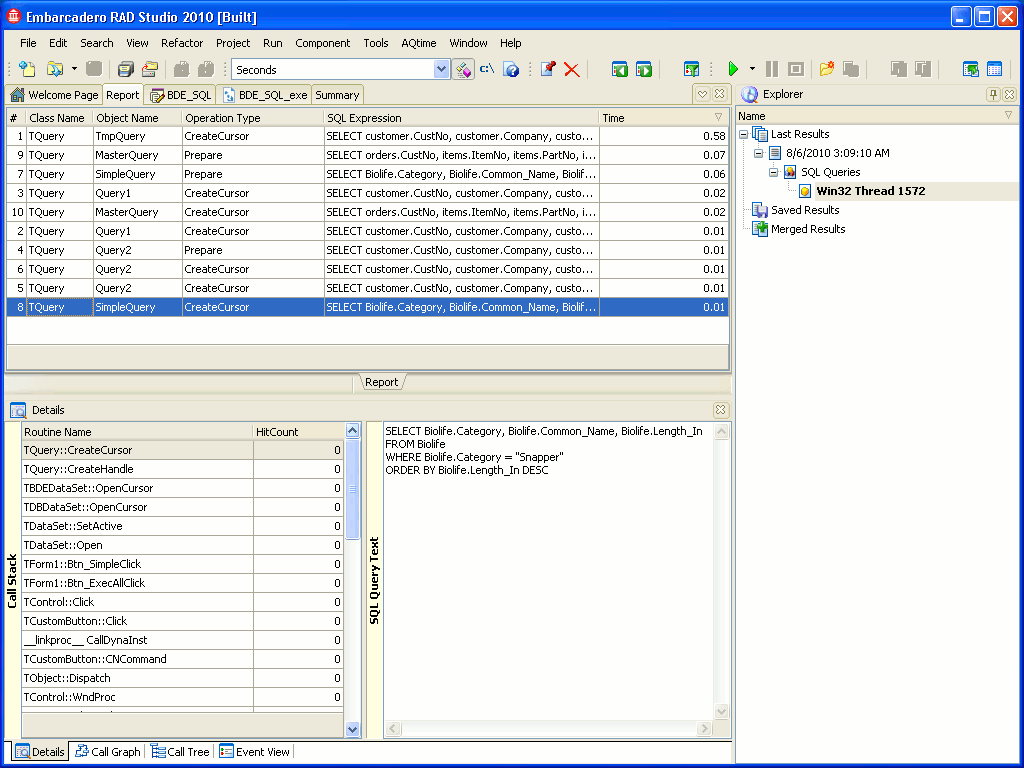
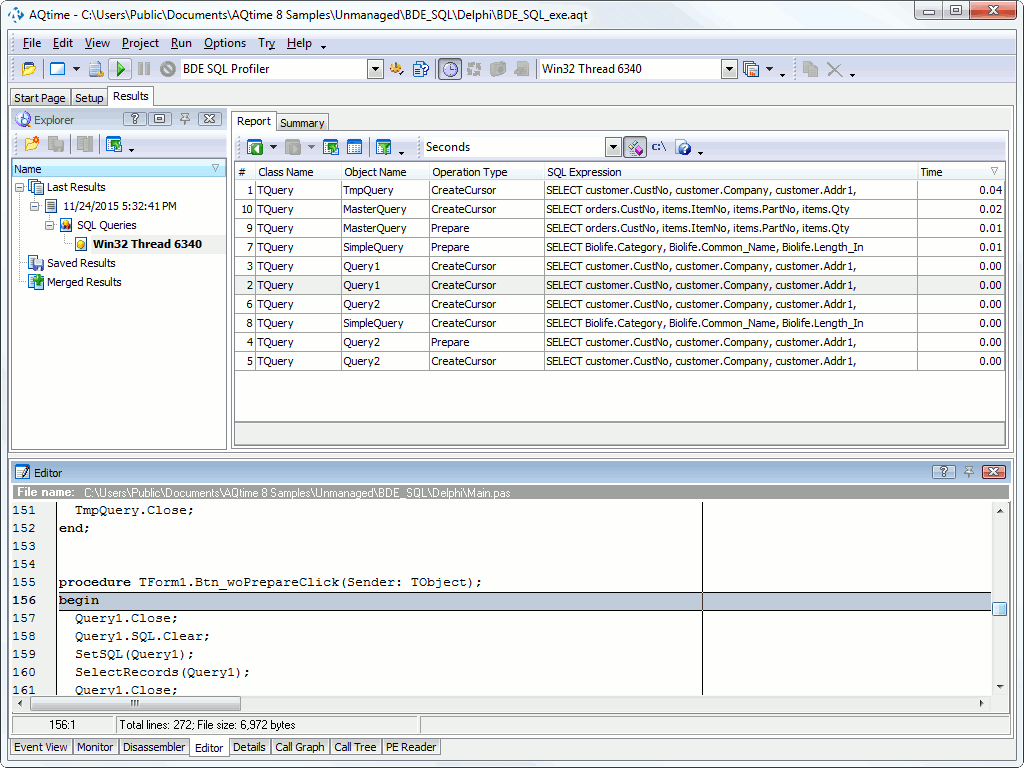
Below is the results that we got in the Report panel for the BDE_SQL sample. It also includes more detailed information about the query that is currently selected in the Report panel (this information is displayed in the Details panel):
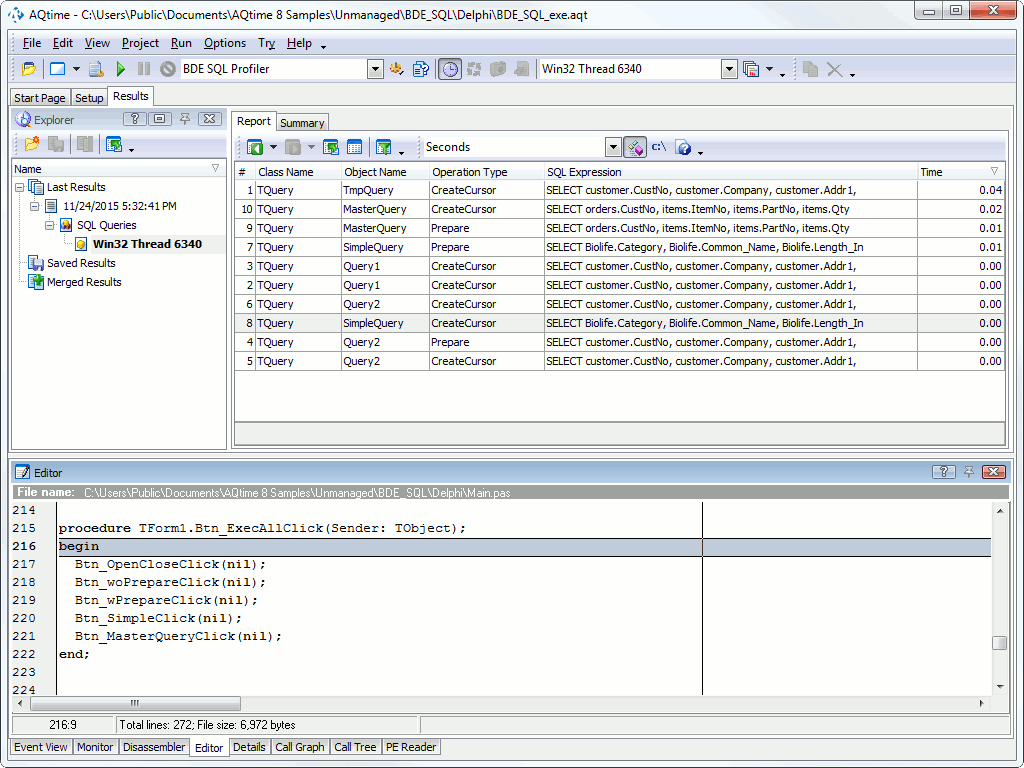
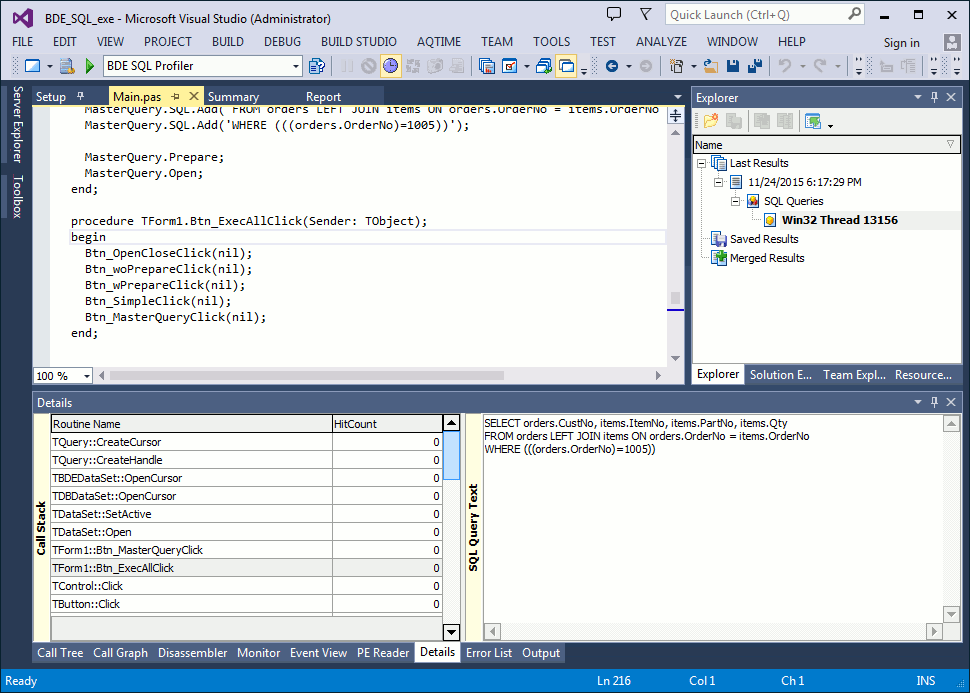
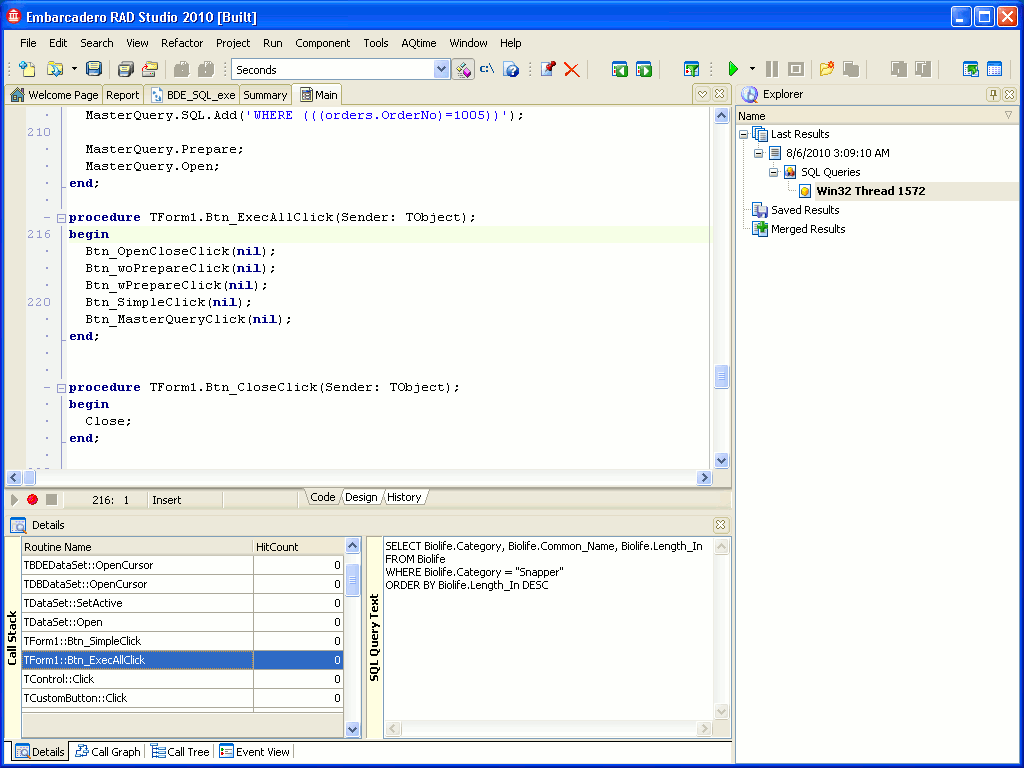
Double-clicking a row in the Details panel moves the cursor to the source code line of the appropriate routine in the Editor panel (the path to the source files must be specified in the Project Search Directories and Search Directory dialogs). Double-clicking a row in the Details panel moves the cursor to the source code line of the appropriate routine on the page that contains the source code. Double-clicking a row in the Details panel moves the cursor to the source code line of the appropriate routine on the page that contains the source code.
For example, let's analyze the following queries: TmpQuery, Query1 and Query2. All of these queries have the same SQL expression, but each query took a different amount of time to execute. The TmpQuery query is intended to equalize initial conditions for Query1 and Query2, as the first opening of a table is executed a bit slower. Query1 and Query2 have the same initial conditions once TmpQuery has run. However, Query1 is executed slower than Query2. Why? Let's explore the source code.
Perform the following actions for both queries:
-
Click Query1 / Query2 row in the Report panel and switch to the Details panel.
-
Find the
Btn_woPrepareClick/Btn_wPrepareClickroutine in the call stack and double-click the row. The cursor will move to the source code.
When comparing the source code of Btn_woPrepareClick and Btn_wPrepareClick routines, you may notice that Btn_wPrepareClick routine calls the Prepare method for Query2, whereas Query1 is executed without the Prepare method. The Prepare method is intended to optimize a query prior to execution. That is the reason why Query1 is executed slower than Query2.

 Prev
Prev