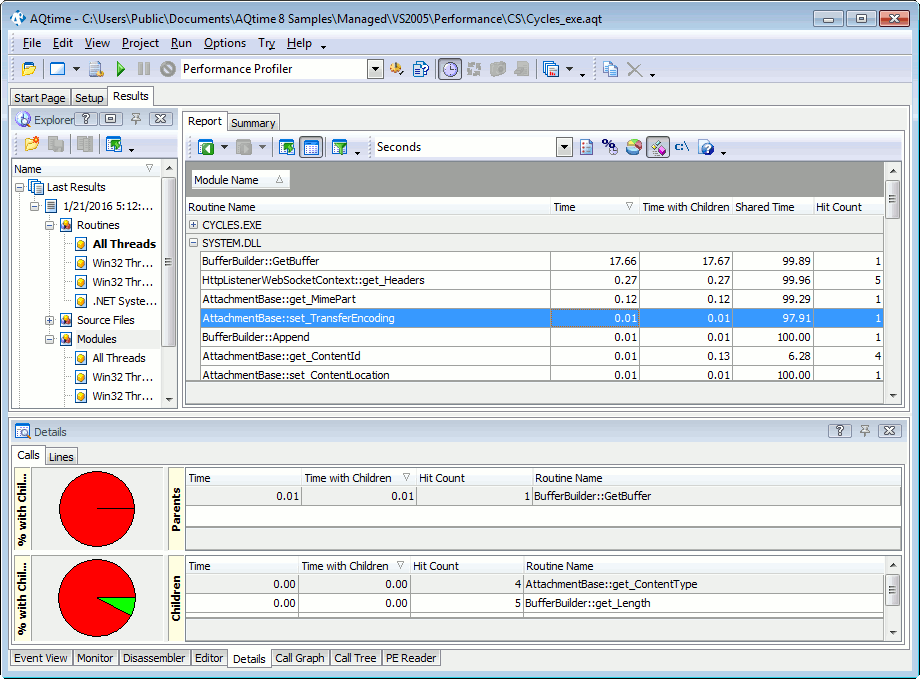
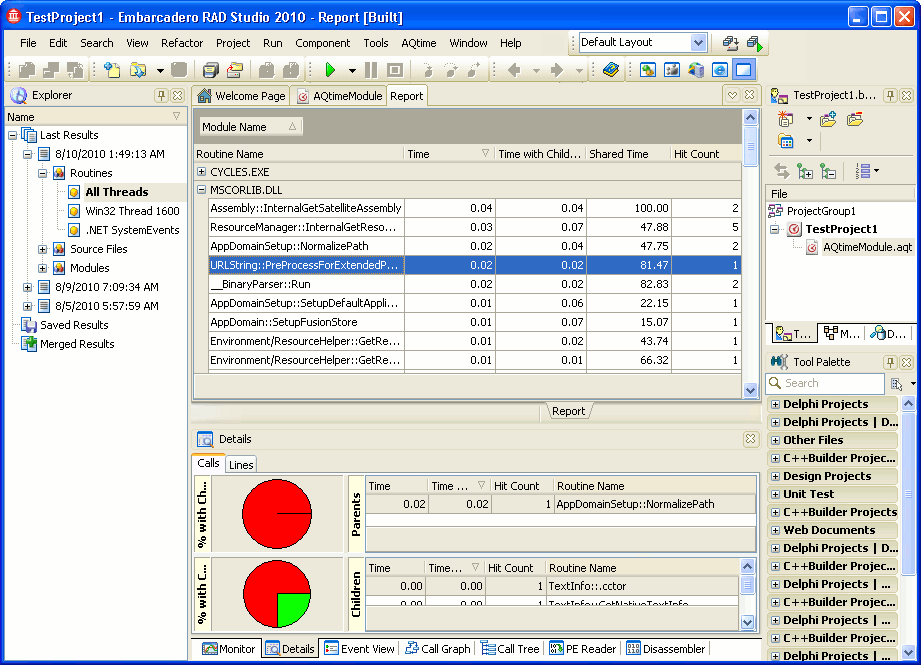
Your applications can use system libraries specific for your operating system (native API) or, if your application is a .NET application, it can use system libraries (assemblies) shared across the .NET Framework platform. Generally, when profiling applications in AQTime, system calls are not traced. This is simply because the system libraries have not been added to the Setup panel.
To profile routines from a system dynamic link library or assembly, simply add this library (assembly) to your AQTime project by using  Add Module (
 Add Assembly) in the context menu or the toolbar of the Setup panel. Run the desired profiler then and you will see functions from these libraries in the profiling results. Note that AQTime profilers will report on the system functions just as they report on application functions. You will be able to examine them with the full range of AQTime panels:
In fact, the described method lets you profile routines from any dynamic link libraries, not just from system ones. The dynamic link libraries may be compiled without debug information, because when profiling calls to library routines, AQTime will use information from the tables of imported and exported functions that are included in each Windows executable. If the dynamic link libraries have no debug info, you can profile them at routine level only.
If your application is a .NET application, you can profile functions contained in .NET Framework assemblies in another manner: you can check the Entire .NET Code box in the Setup panel. If this box is checked, AQTime will profile all assemblies whose routines are called during the profiler run. It will profile even those assemblies and routines that are not added to areas. This is especially useful, if you do not know exactly what libraries your application depends on. However, using AQTime you can easily determine which libraries it uses and then include them in the profiling tasks. See Trace Libraries Your Application Uses.
We would like to note one more time that the Entire .NET Code box lets you profile only .NET Framework assemblies. If you would like to profile routines from the operating system DLLs, you should add these DLLs to custom areas.
The .NET Framework assemblies call functions from the operating system libraries using special stub functions that prepare parameters and call functions from the operating system libraries. If you check Entire .NET Code or if you add the .NET Framework assemblies to the Setup panel, AQTime will profile these stub functions. To profile functions from the operating system DLLs, add these DLLs to the Setup panel.
See Also
3. Choosing What to Profile and When
About Areas
Profiling Dynamic Link Libraries


