
It is possible that two different routines, for instance, the AddRef methods of two different classes in a Visual C++ application, have the identical binary code (this is duplicated code). By default, the Visual C++ linker detects such routines and does not duplicate the code. Instead, it generates only one sequence of binary instructions that suits both occurrences. In this case, the debug information says that two different methods have the same address in memory. If both methods are included in profiling tasks, AQTime will profile only one of them. The other “duplicated” routines will be excluded from profiling (they will have zero profiling results). For all the routines whose code is duplicated, the Analysis Result column, which is available in the Details panel for the Performance profiler and in the Report panel for the Performance and Coverage profilers, will hold Duplicated code.
In other unmanaged applications, similar behavior of linkers regarding duplicated code is possible as well.
If your Visual C++ 7.x application includes routines that have duplicated code and you want to profile them as separate routines in AQTime, do the following:
- In Visual Studio, open the Project Properties dialog for the project you are going to profile (for example, by using Project > Properties).
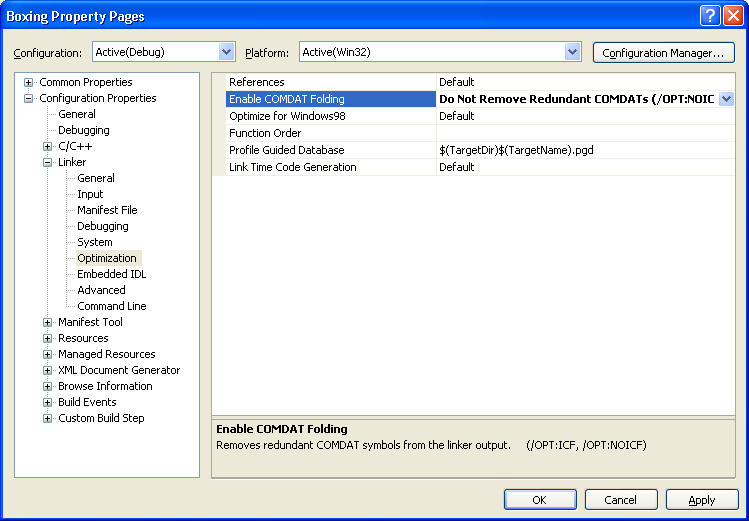
- Select Configuration Properties > Linker > Optimization on the left of the dialog.
- Locate the Enable COMDAT Folding option on the right of the dialog.
- Set this option to Do Not Remove Redundant COMDATs (/OPT:NOICF).
- Click OK to close the dialog.
- Rebuild the project.
Now your project’s debug information will have an individual section for each routine whose code is duplicated among other routines. As a result, these routines will not be excluded from profiling in AQTime. Instead, you will be able to profile these routines separately and get non-zero profiling results for each of them.
See Also
Routines That Cannot Be Profiled
Performance Profiler Results - Overview