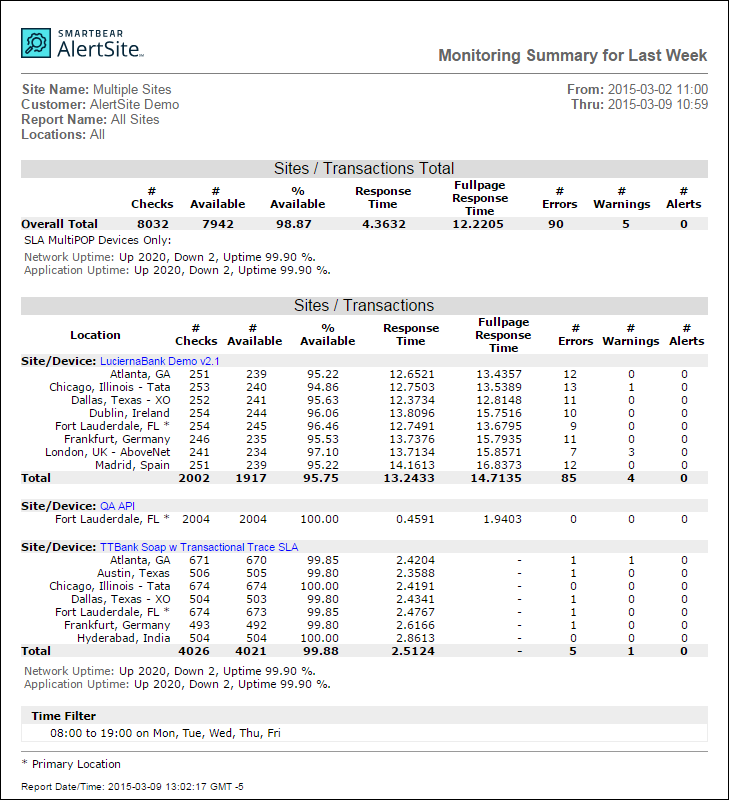
The Scheduled Summary Report (or Monitoring Summary) is a scheduled report that provides an overview of monitoring activity for the specified reporting period.
For one, several, or all monitors, shows the number of checks done, % availability, average response time, the number of errors and warnings occurred, and the number of alerts sent.
You will receive the report by email and can also view it in the Document Manager.
Creating the report
This report can only be scheduled and cannot be generated on demand. The date range you select for the report also determines how often you will receive the report – daily, weekly, monthly and so on. To configure the report:
AlertSite UXM
-
Select Reports > Performance Reports from the top menu.
-
Select the Scheduled Summary report type.
-
Select one, several or all monitors.
-
Select one, several or all locations.
-
Select a date range.
-
Specify the desired report options and the data to include.
-
Click Run Report.
AlertSite 1.0
-
Select Reports > Performance Reports from the top menu.
-
Select several monitors or All Sites from the Site/Device list.
Note: If you want to get the report only for one monitor, use AlertSite UXM (the new interface). -
Select the Scheduled Summary report type.
-
Select one, several, or all locations.
-
Select a date range (Yesterday, Last Week, Last Month, etc.).
-
Specify the desired report options and the data to include.
-
Click Create Report.
AlertSite will display the Report Scheduler dialog to configure the scheduling options.
-
Select the report format:
- HTML
- Text
- CSV
-
Choose how the report will be included in the email:
- Link
- Embedded
-
Enter a name for the report.
-
Add the names and email addresses of the people to send the report to.
-
Click Save to schedule the report.
The report will be delivered via email in the selected format (HTML, plain text or PDF).
Report Data
Column descriptions
The report lists the selected monitors. The results of each monitor are grouped by locations. The overall summary is shown at the top of the report.
The report contains the following columns:
| Column | Description |
|---|---|
| Location | The AlertSite location name. |
| # Checks | The number of tests performed during the report period. |
| # Available | The number of successful tests. |
| Available | The percentage of successful tests. |
| Response Time | The time it takes to download the page’s HTML source (without scripts, images and other external files). For details, see Response Time. |
| Fullpage Response Time | The time it takes to retrieve the web page and all of the scripts, images, CSS files and other data used on the page. For details, see Full Page Response Time. |
| # Errors | The number of times we encountered a problem. |
| # Warnings | The number of generated warnings. |
| # Alerts | The number of times alerts were sent. |
In addition to the metrics above, the report for ServerAgent monitors (they monitor the private location health) contains the following:
| Column | Description |
|---|---|
| # OK | The number of times your private location metrics were within the thresholds. |
| % OK | # OK expressed as a percentage. |
| The number of times the metrics measured by ServerAgent exceeded the error threshold. | |
| # Check-In Errors | The number of times ServerAgent did not report to AlertSite in time. (For example, the connection was lost or ServerAgent was not running.) |
Uptime measurements
If you have monitors with service level agreements configured, the report also contains Network Uptime and Application Uptime metrics:
-
Application Uptime is reduced by any correlated error, as a user would not have been able to complete their interaction.
-
Network Uptime is only reduced by network-related correlated errors attributed to the following statuses:
-
Status 1: TCP connect error.
-
Status 2: Timeout (can be network related).
-
Status 6: No response from server (can be network related).
-
Status 9: Ping error (site configured as pingable was not).
-
Status 51: DNS lookup error.
-
The monitor is up if any measurement is successful during a correlated measurement interval. Uptime statistics are especially useful in management and assurance of SLAs, since they can accurately reveal if the web service was at all available.

