
After the test finishes, TestComplete shows the test log with the results of all test operations.
The results of our test look as follows:
: iOS automated test log")
Click the image to enlarge it.
The log contains messages of different types: actions, events, checkpoints, and so on. You can filter the messages using the toolbar above the message list. If you double-click a log message, TestComplete will navigate to the test operation that posted this message. This is useful when you need to know which operation caused an error.
The Picture panel contains images that show the expected and the actual application states before the selected test command is executed (“Expected” is the image that was captured for the command during test recording, and “Actual” is the image that was captured during the test run.) The Actual Image toolbar has a special button that lets you highlight the difference between the images (if any). The images help you understand what happened in the application during the run, view the differences, and find errors faster. For more information on capturing images, see the topics of the Test Visualizer section.
The Details panel contains details on the performed operation. For example, Details for property checkpoints includes the check type (equals, contains, matches a regular expression, and so on) and other details.
There are two more panes at the bottom of the log:
-
Call Stack is useful when debugging tests that call each other. It shows the sequence of test calls that led to the current operation or error.
-
Performance Counters shows local or remote computer metrics (CPU load, memory usage and so on) measured during the test run. We do not use performance counters in our tutorial, but if you have a client-server iOS application, you can set up performance counters to track your server metrics.
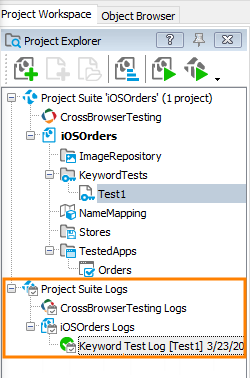
All logs are kept under Project Suite Logs > ProjectName Logs in the Project Explorer, so that you can review the previous logs.
| Note: | By default, TestComplete stores all test results in log files. The number of the log files will grow with every test run, and this will result in the memory consumption increase. To reduce memory usage, you can delete files from the log manually or limit the number of log files to be kept. |
Resolving Errors
Your test may fail. There can be a lot of reasons for this. For instance, it may fail due to the changes the developers made to the application, a third-party application may overlap some windows of your application and the test engine will not be able to simulate actions on them, and so on.
One of the most typical reasons novice users face is different application states during the test creation and playback. To avoid this problem, make sure that the initial conditions of the test run correspond to those you had when creating the test. For instance:
-
If the tested application had been running before you recorded a test, it must also be running before you run the test.
-
If the test actions were performed on a particular screen of the application, you should open the screen when running the test.
-
If you edited any data in the application, and then saved it, you need to revert the changes.
Sometimes, the test engine fails to find an application object because it needs to wait for a specific application response. To solve this problem, insert a delay command and specify for how long the text execution should be paused:
-
In keyword tests, use the Delay operation with the Delay Time parameter specified.
-
In scripts, use the
aqUtils.Delaymethod with the loop body.
For more information on how to find and fix errors, see Handling Playback Errors and Debugging Tests.
 Prev
Prev
See Also
About Tested Application
About Test Log
Handling Playback Errors