
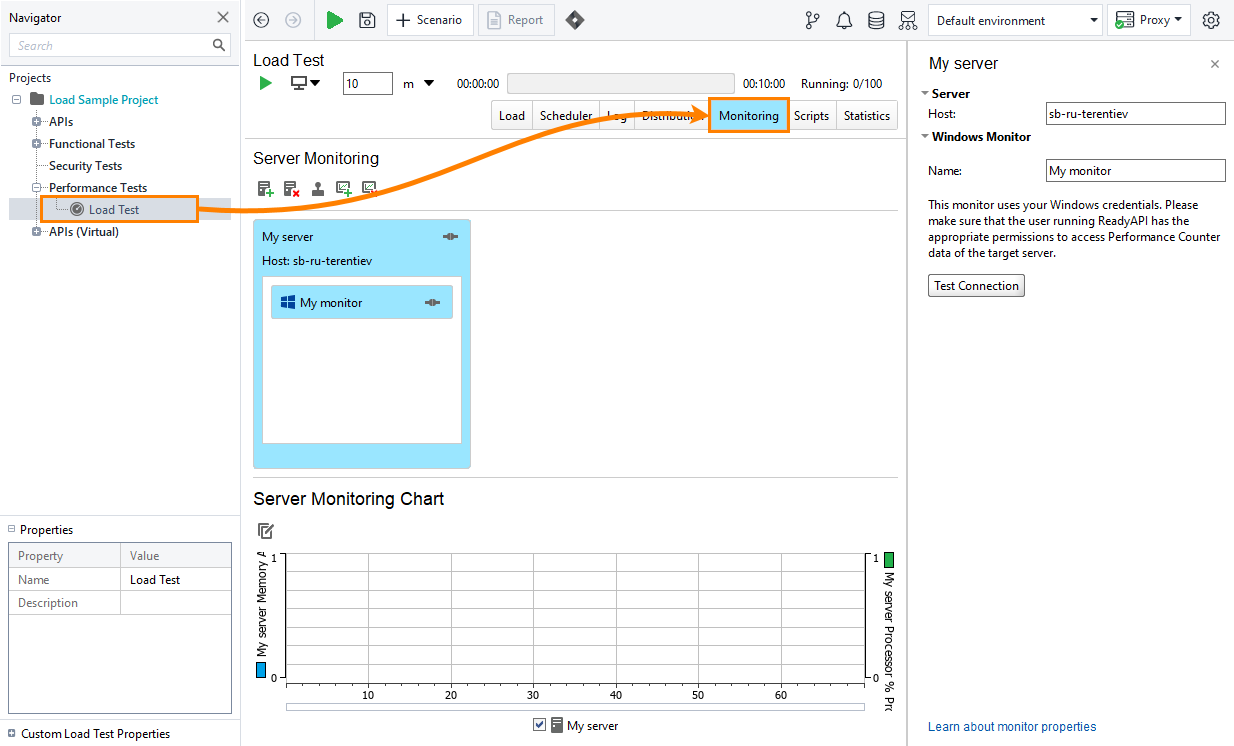
When running load tests, you create a load that should be handled by the server in a specific way. You can use ReadyAPI to track various metrics of the web servers you run your tests against, and check if they perform as you expected. To do this, you use the Monitoring page.
Click the image to enlarge it.
ReadyAPI gathers all available metrics from tested web servers during a test run. ReadyAPI displays the most important metrics as graphs at the bottom of the page in real time during the test run. On the Statistics page, you can view all gathered data. Usually, it is all the available server metrics and statistics of the test, such as the number of simulated users and server response time. Use these metrics to find performance bottlenecks of your server and fix them.
Requirements
![]() To monitor server metrics, you need a ReadyAPI Performance license. If you do not have it, you can either request it on our web site or start a trial.
To monitor server metrics, you need a ReadyAPI Performance license. If you do not have it, you can either request it on our web site or start a trial.
Supported Server Monitors
ReadyAPI supports the following monitors:
Operating systems
Web servers
Application servers
Virtual Machines
Databases
Configuring Servers for Monitoring
Before monitoring the server, you need to configure it to provide ReadyAPI access to the metrics. For information on configuring web servers, see Preparing Servers for Monitoring.
Quick Start Guide
To start monitoring your server, follow the steps of the Quick Start Guide. It explains how to add a server to the list of monitored servers, add monitors and configure runtime metrics.
Managing Server Monitors – How To
For information on how to perform specific actions such as adding monitors or changing the server address, see the How to section.