Let’s run the scenario we created on the previous step.
Start a load test
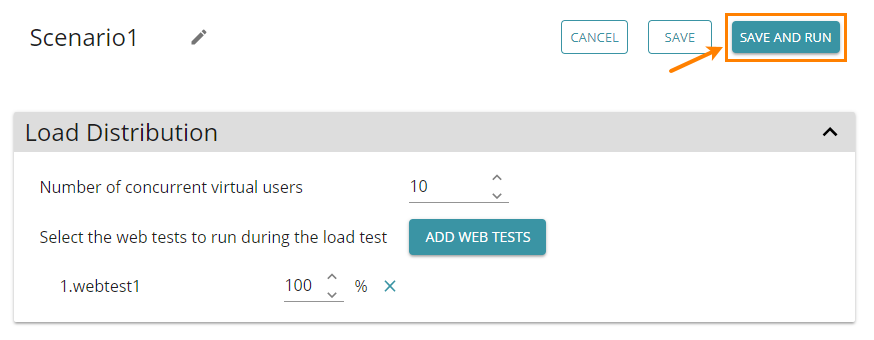
To start a load test, in the scenario editor, click Save and Run.
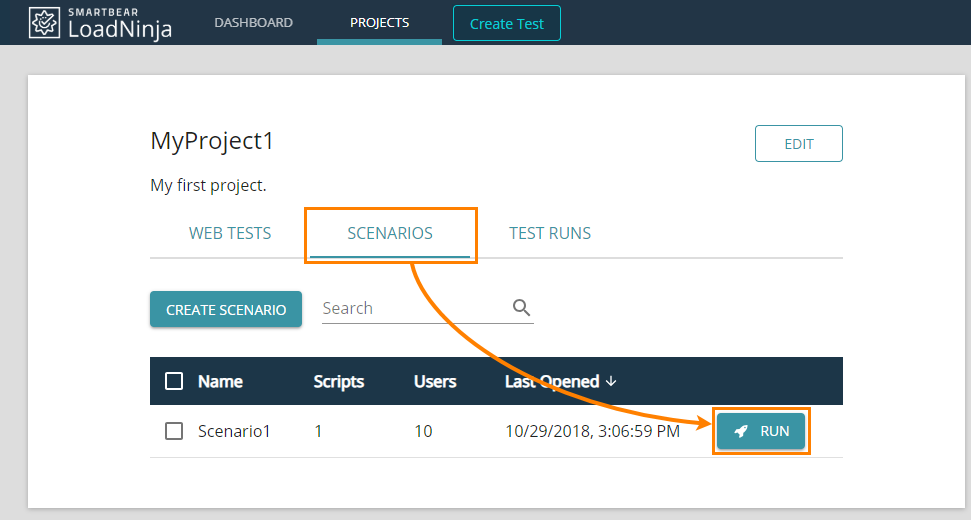
A possible alternative is to run a scenario from the project’s scenario list:
When a test heats up and starts
Initially, on a test’s launch, you will see the timer. While this timer is on the screen, LoadNinja allocates the cloud machines needed for simulating the requested load and prepares virtual users.
After these preparatory steps, you will be able to monitor the progress of your load test in real time.
Monitor the test run
In LoadNinja, you can monitor the test results in real time and debug issues that occur during the virtual user simulation.
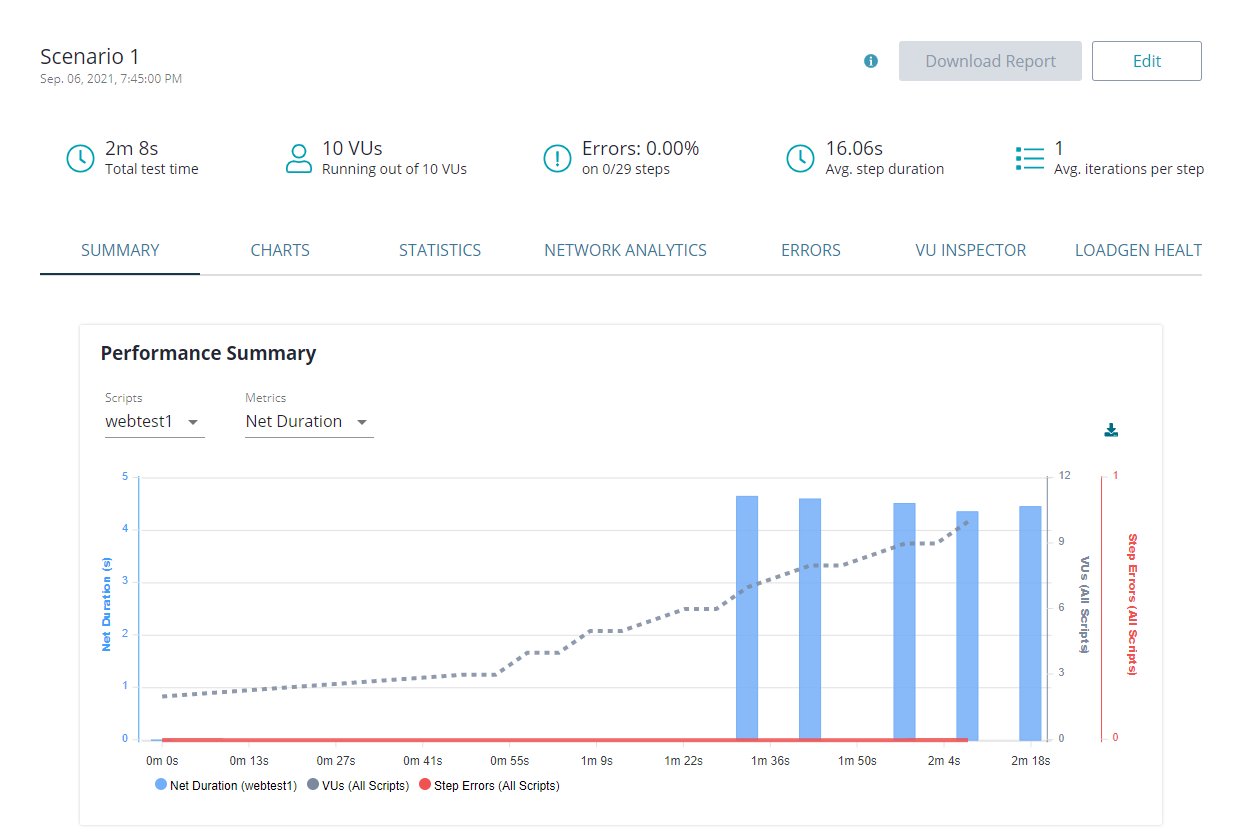
The Summary tab provides general information on the run: the number of virtual users working, the number of errors that occurred, and so on.
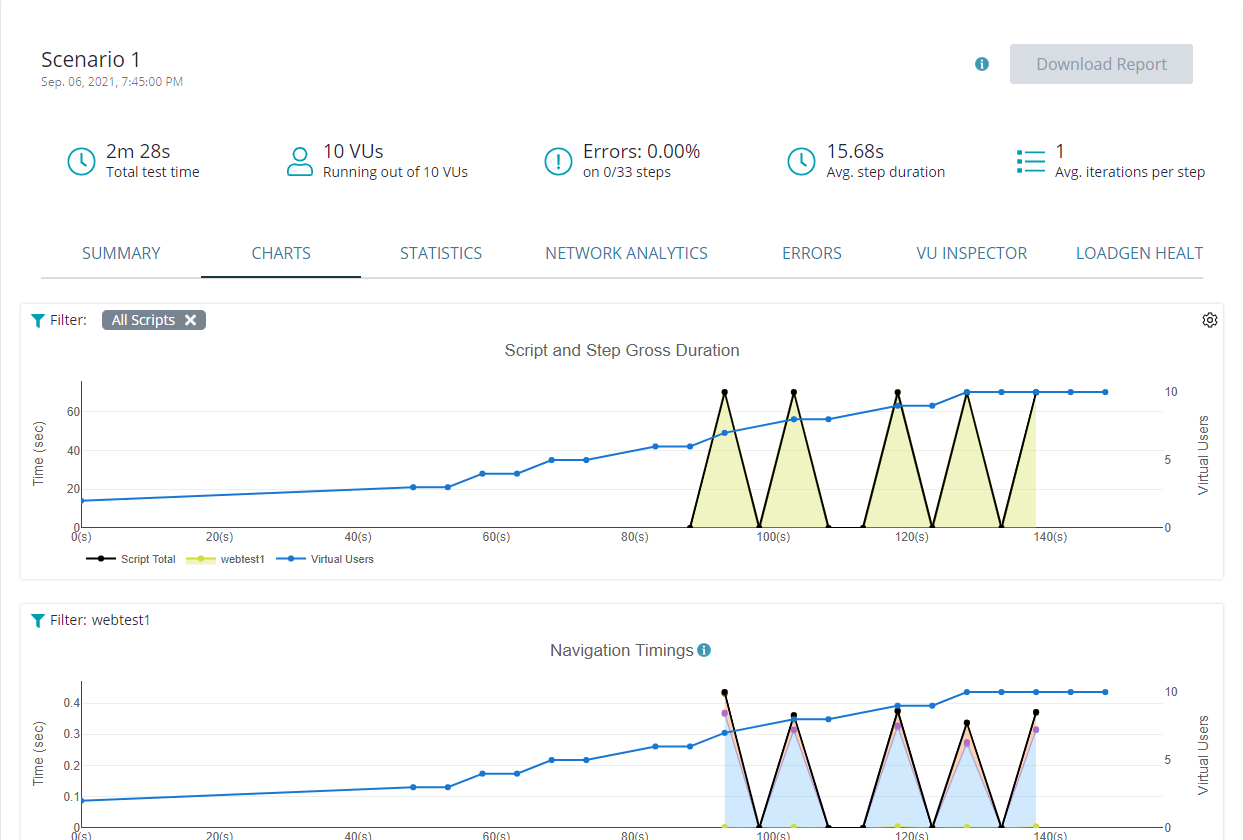
On the Charts tab, you can see accumulated results in the graphic form. Click ![]() on the top right of the first chart to select the metric to show in it:
on the top right of the first chart to select the metric to show in it:
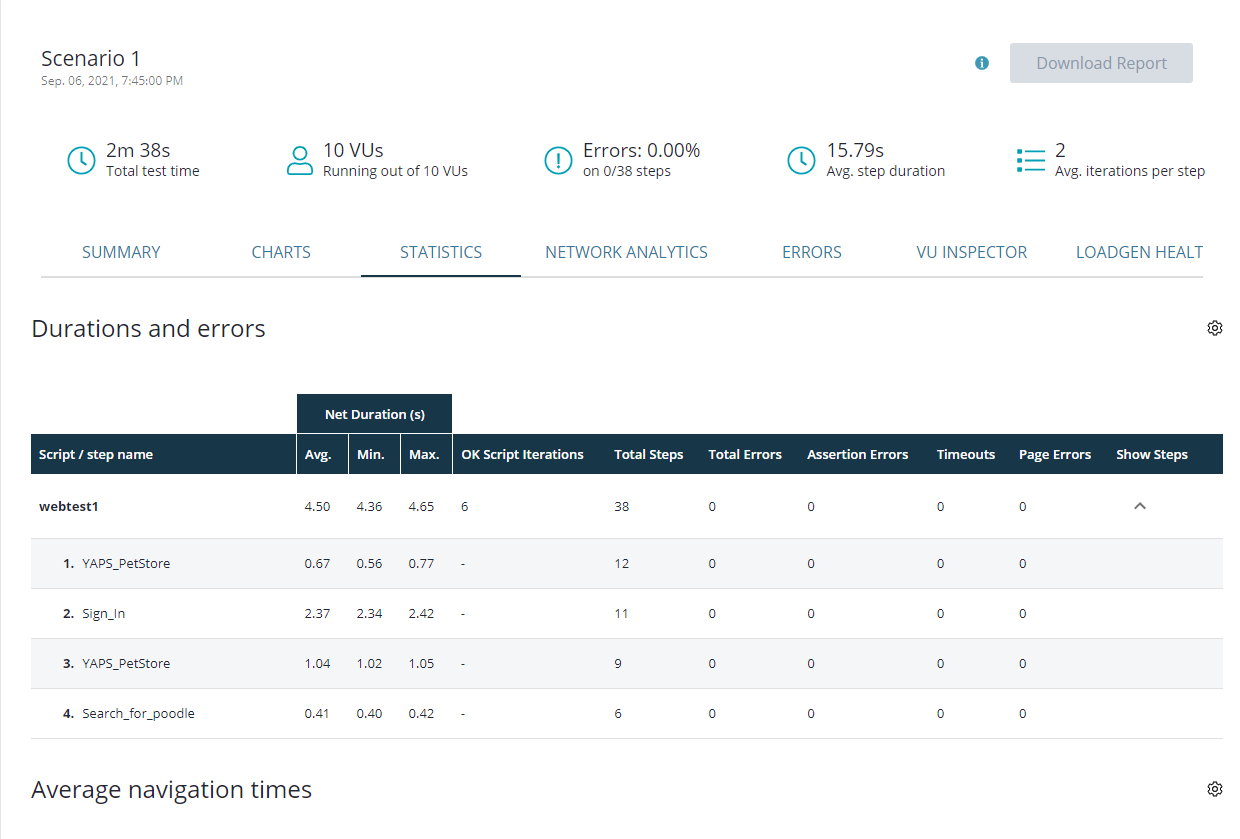
The Statistics tab provides results of individual tests and test steps: (in our example, we have only one UI test; in your projects, you will see results of each UI or API test you use in your scenario). Click ![]() on the top right of a table to select the metrics to show:
on the top right of a table to select the metrics to show:
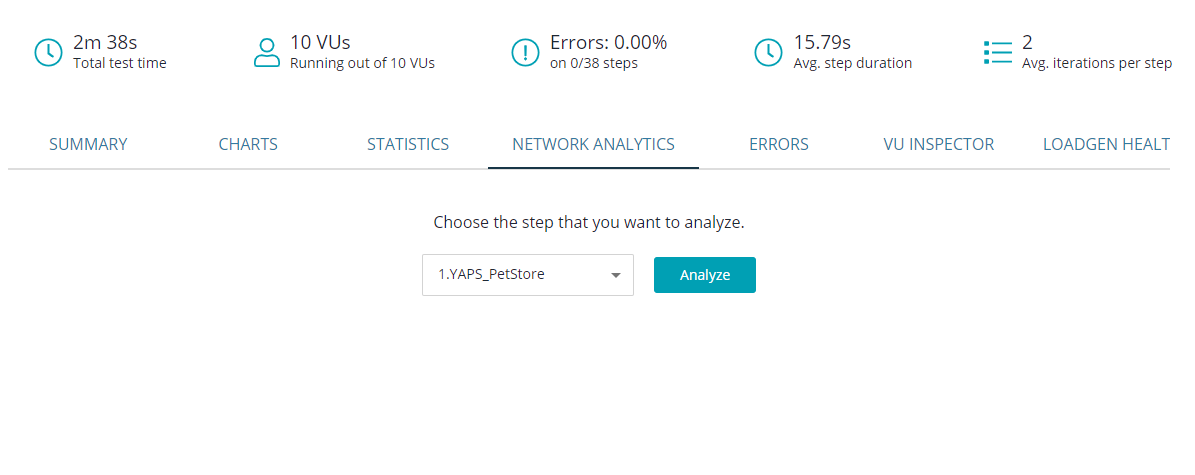
The Network Analytics tab helps you analyze test steps with the built-in AI. It works best after the load test is over, not during the run.
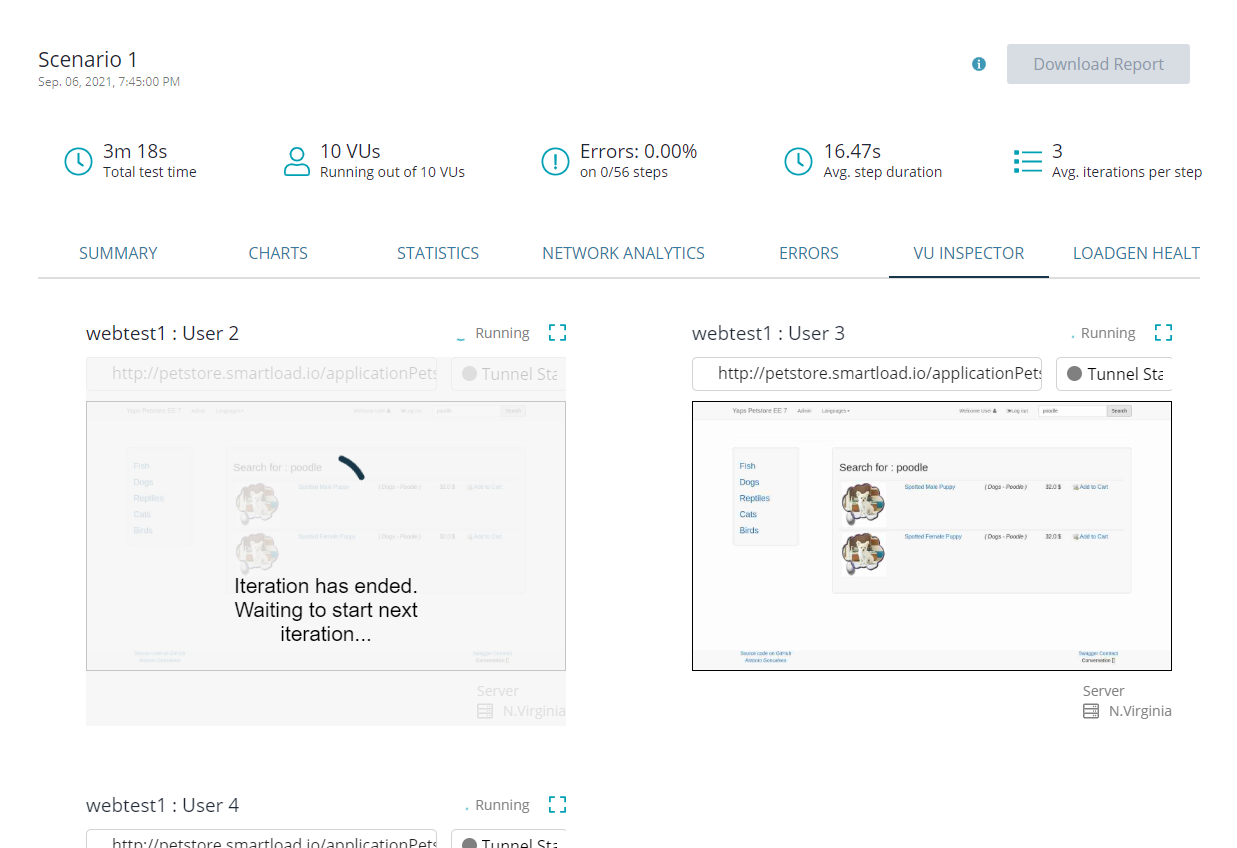
On the VU Inspector tab, you can view desktops of remote cloud machines where virtual users are working. For each frame, you can see the virtual user ID, the name of the script it runs, and the URL the user is on. On the right, you can check the percentage of active virtual users, percentage of successful scripts, and average throughput (how many requests at a time the website handles):
When the test run finishes, the VU Inspector will hide. You will still be able to view the results on other tabs.
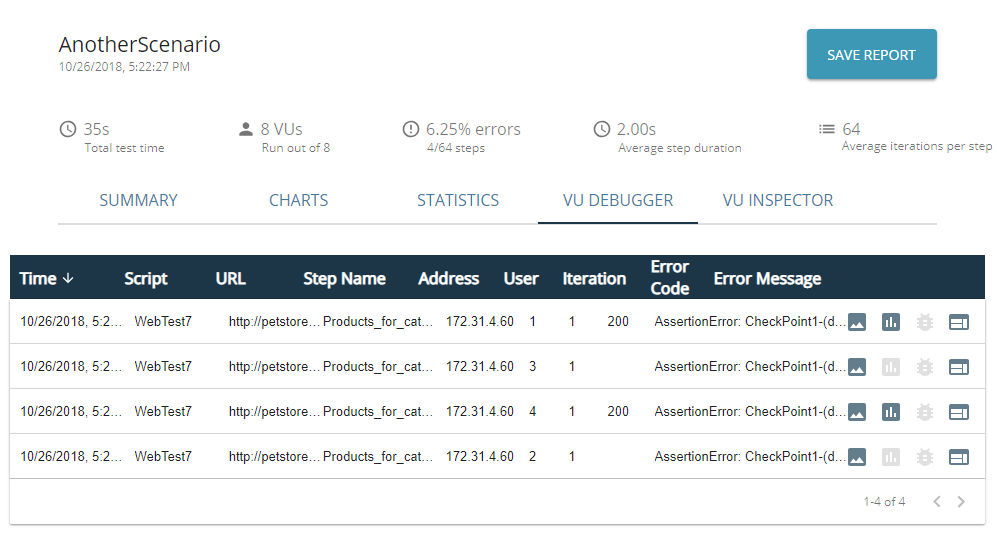
On the Errors tab, you can see information on errors that occur during the run. Our test will run without errors, most likely. Your tests might have errors. Here is a sample view of the Errors tab:
Use the buttons on the right to dig deep into the error cause. You can —
| Command | Description |
|---|---|
| View the image of a web page on a cloud machine, where an error occurs. | |
| Get information on loaded resources. | |
| Get the HTML code of the problematic page. | |
|
Debug virtual users This will open a connection to the remote cloud machine. You will be able to run commands in the remote browser console to better understand what happened with the page. See Debug Virtual Users for details. |
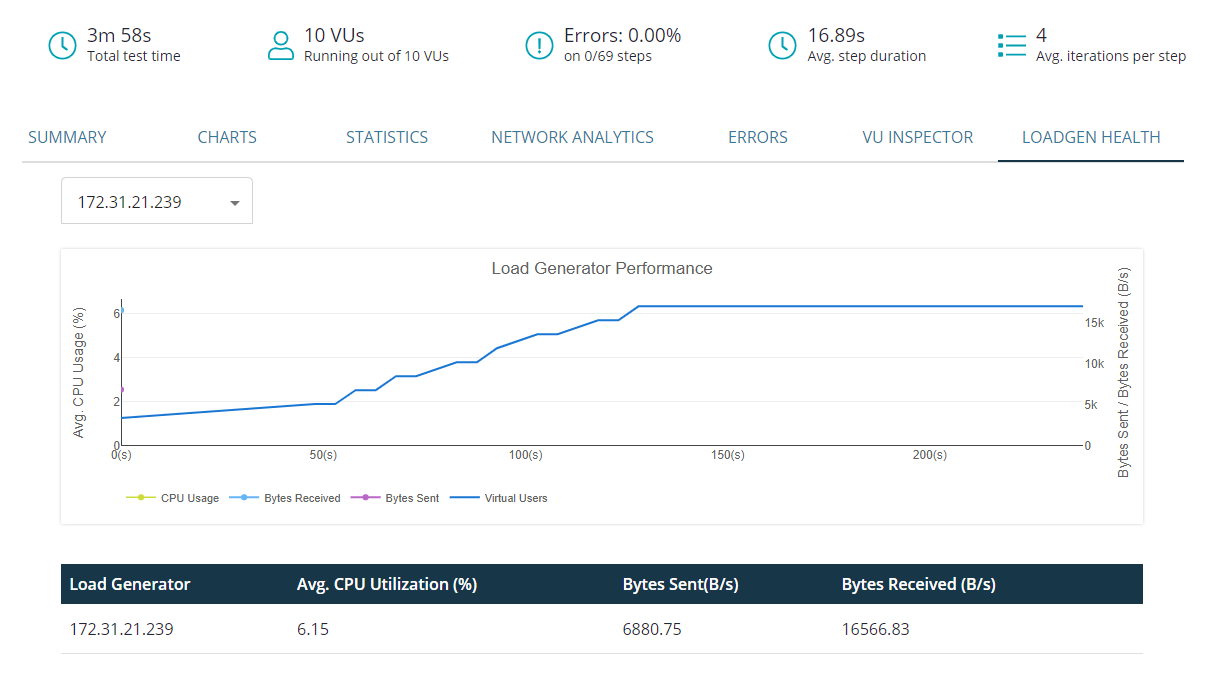
The Loadgen Health tab displays performance metrics of the LoadNinja test servers. It is helpful to find cases when performance slowdown is caused by the test infrastructure.

