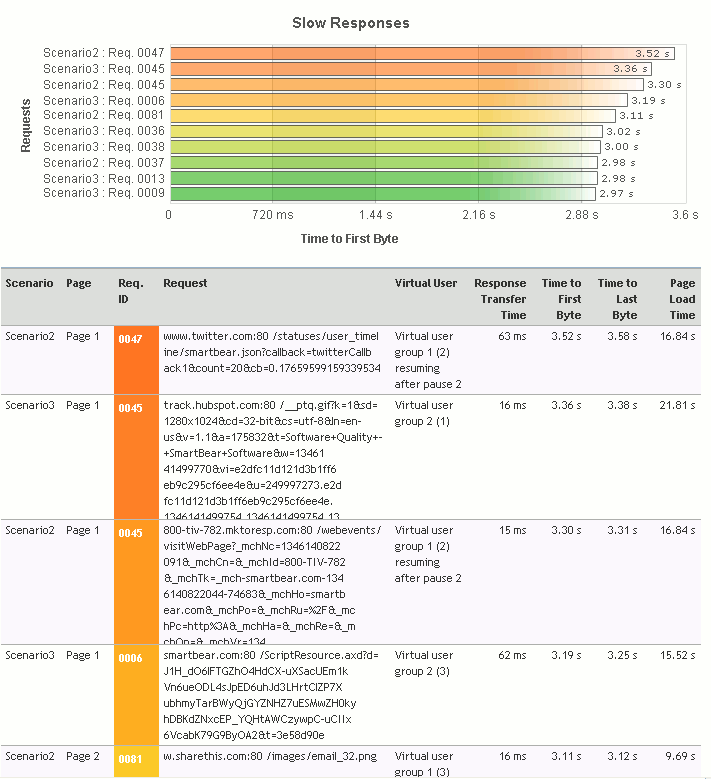
The Slow Responses section of the Report panel contains information on the slowest responses that were received from the target server during the test run. The header of the section contains a list of responses that were received during the longest period of time.
The Top 10 list includes only unique requests. That is, if a request was simulated several times during the test run, only the slowest one will be included in the list.
Note: The Top 10 list does not include requests that were simulated with errors. Requests simulated with warnings and requests violating SLA criteria are considered successful and are included in the Top 10 list.
To View the Section
-
Open the desired Report (if it is not open yet). To do that, expand the test log item node under the Project_Name Logs folder in the Project Explorer and double-click its child Report node.
-
In the Report, select the Top 10 tab and expand the Slow Responses section.
Requirements
To view this graph, set the Store log data option to All data (Report + Details). Do this before running your test. Otherwise, the graph will not be shown.
| Note: | During scenario verification, LoadComplete ignores the logging option and saves all the required data anyway. |
The Slow Responses List
The list contains ten slowest responses that were received from the target server by the test. Along with the URLs that correspond to the appropriate requests sent to the server, the list also contains a diagram with a graphical representation of the responses' receiving time. This diagram specifies the receiving time of each response from the list. Note that the color that corresponds to a response in this diagram is also used to highlight the page’s URL in the table under the list.
The Loading Time Table
The table contains statistics on the receiving time of the slowest responses in a tabular format. The following columns are available:
| Column | Description | ||
|---|---|---|---|
| Scenario | The name of the scenario that corresponds to the specified response. | ||
| Page | The serial number of the page that corresponds to the response. | ||
| Req. ID | The request identifier shown in the Requests tree right after the request name. | ||
| Request | The URL of the page that was used to send the request that corresponds to the response. | ||
| Virtual User | The virtual user that received the response at the specified time.
|
||
| Page Load Time | The overall page load time. | ||
| Response Transfer Time | The overall response receiving time. | ||
| Time to First Byte | The value of the response’s Time to First Byte metric. | ||
| Time to Last Byte | The value of the response’s Time to Last Byte metric. |
See Also
Top 10 Page of the Report Panel
Report Panel
About Test Results
Test Result Panels
Creating and Configuring Load Tests

