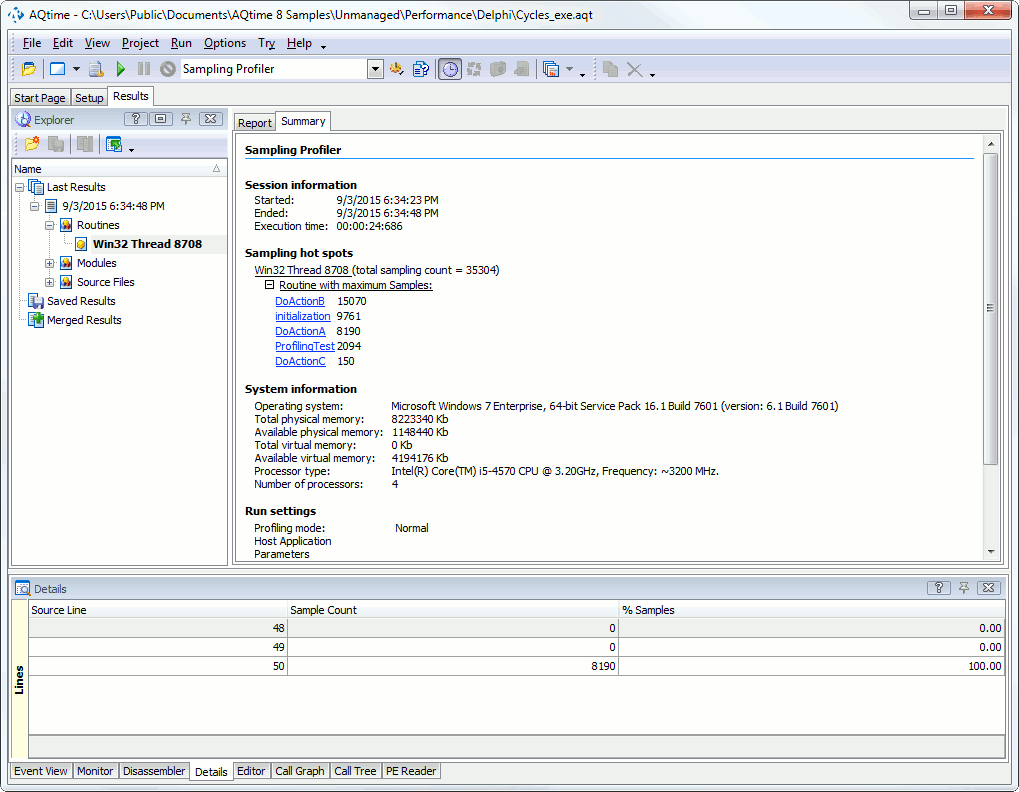
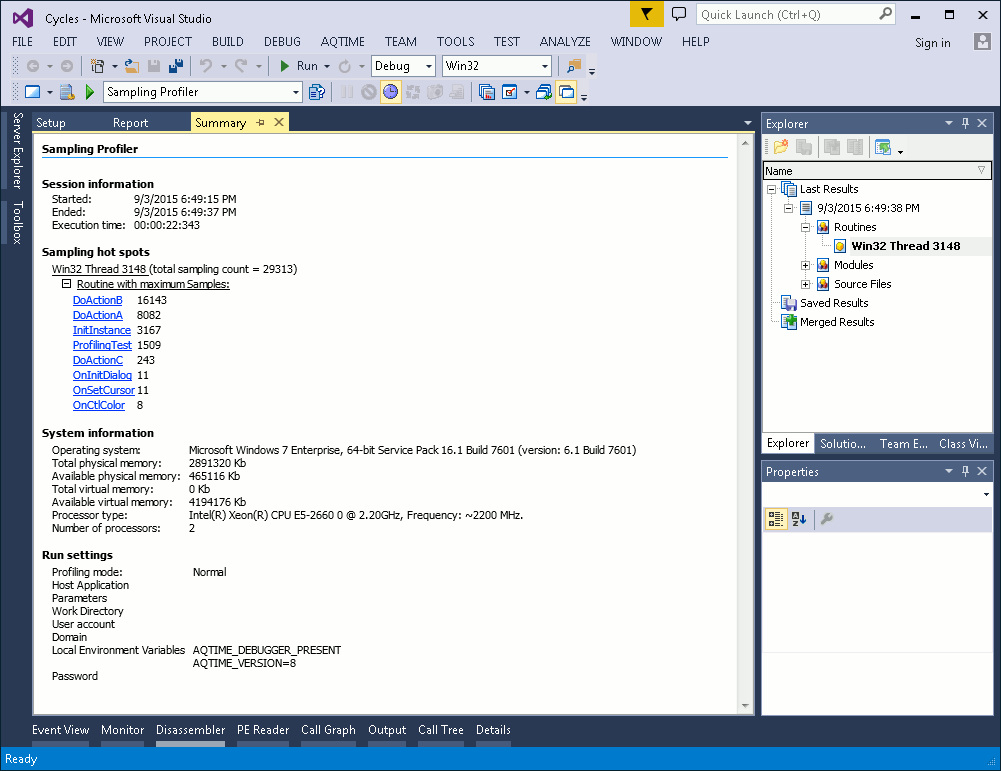
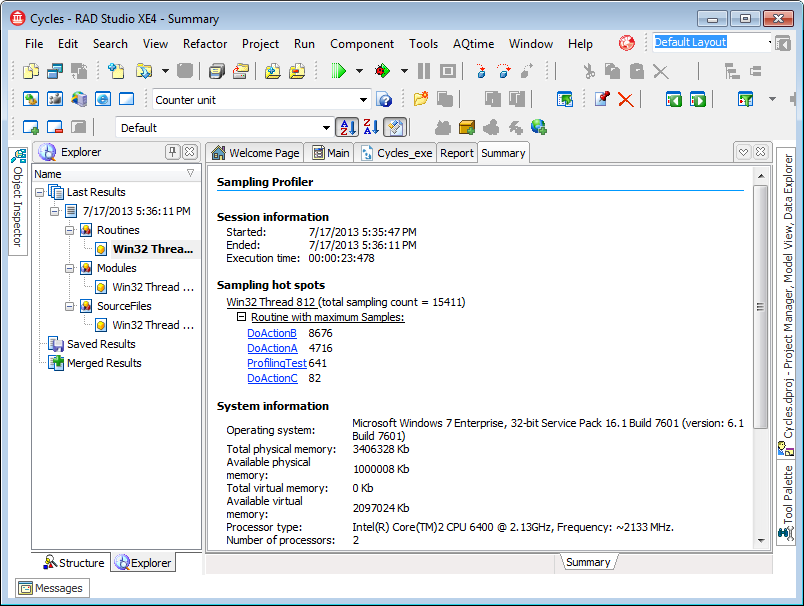
First, take a look at the Summary panel. It displays some a summarized analysis, which AQTime has made for us:
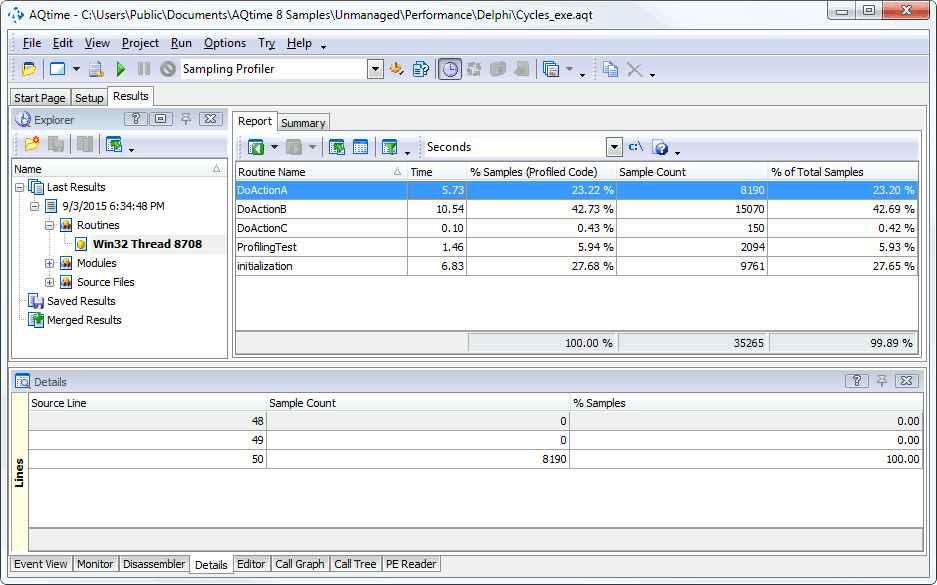
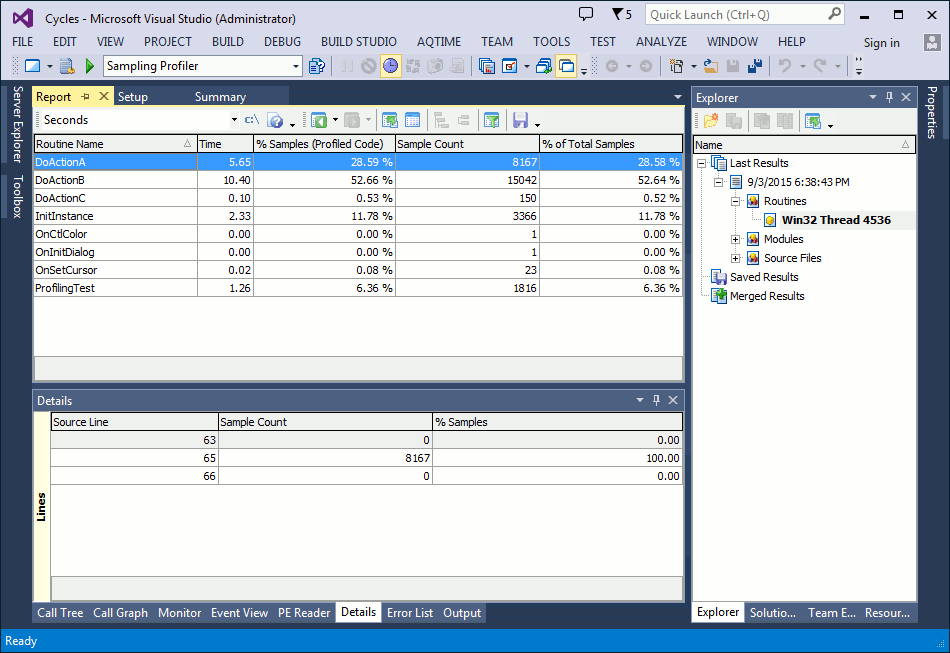
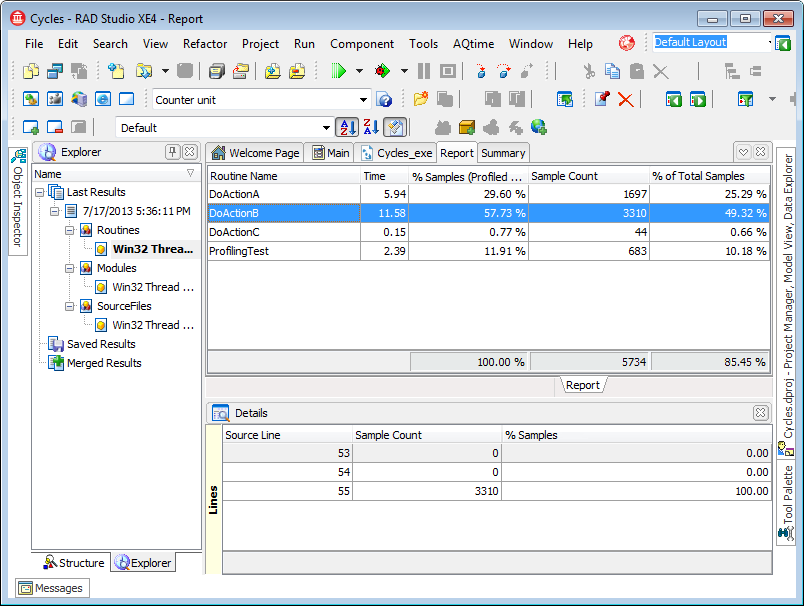
Here you can see a list of the top functions that took the most number of samples during profiling. For more detailed results on each function, switch to the Report panel. This panel displays a list of the routines that took at least one sample during profiling. Below is a sample view of Sampling profiling results:
For each routine, the Sampling profiler displays the number of taken samples (in the Sample Count column) and the approximate time of routine execution (in the Time column). This time depends on the number of samples and provides only an approximate estimation of the actual execution.
To find the most time-consuming function, sort the records in the Report panel by the Sample Count or Time column. The DoActionB function takes more samples than any other function (8678 samples). This function reduces the performance of our application. There may be two possible reasons for such poor execution: the function is called too many times or the code is poorly written. For a small project, you can analyze the source code to determine unnecessary function calls. You can also use the HitCount or Performance profiler to detect these calls. If there are no unnecessary function calls, you can use the Sampling profiler to find the slowest code in the function.
Now, you can create an including line-level area and add the DoActionB routine to it. Then, you can continue exploring the routine's performance with the Performance profiler. Walk through the Performance Profiler Tutorial to learn how to use the Performance profiler for timing the application performance.

 Prev
Prev