The Exception Trace profiler monitors the application execution and if an exception occurs it outputs exception information on the Event View panel. The following sections provide an overview of the profiler:
General Information
The Exception Tracer supports both Win32 and Win64 applications, works faster in comparison with other profilers and does not slow down the tested application. Use it if you only need to explore exceptions that occur during the application execution.
Since the Exception Tracer uses the Event View panel, the Exceptions > Active option of this panel must be turned on. Otherwise, the Exception Tracer displays an error message and does not start profiling. The other Event View options specify what information will be displayed when the exceptions occur.
Exception Trace Profiler Results
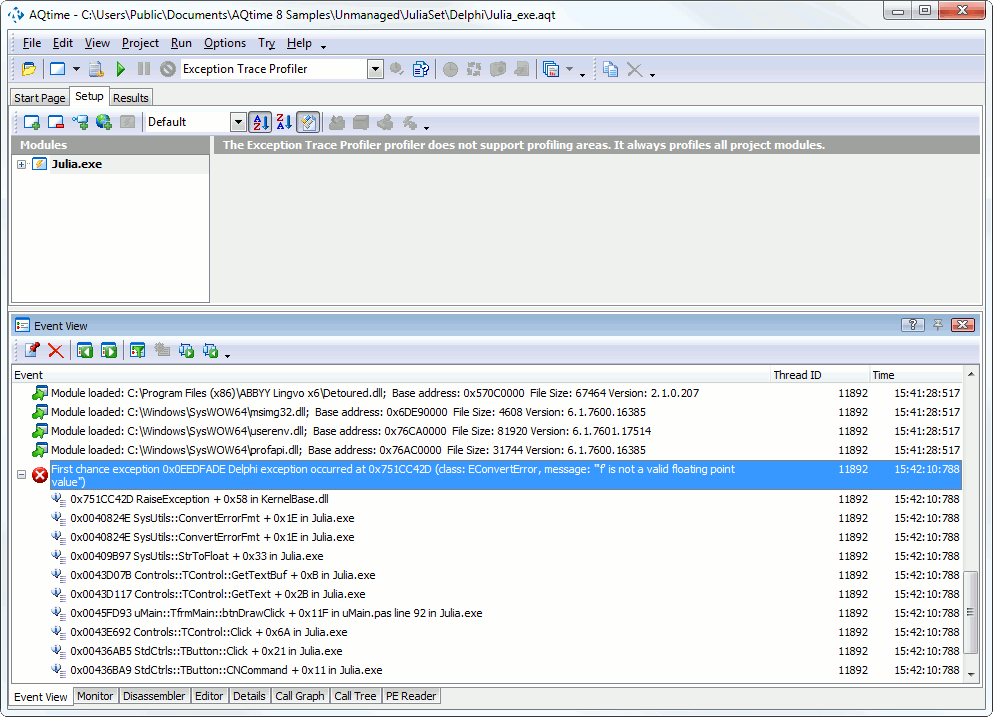
The profiler outputs exception information (exception type, address, call stack, and so forth) to the Event View panel:
You can view the source code of a routine in the call stack: simply double-click the routine in the Event View panel and then switch to the Editor (note that the path to the source files must be specified in the Project Search Directories or Search Directory dialogs).
If you want the call stack to be reported to a file, enable the panel’s Text file > Active or XML file > Active option. You can also use panel settings to filter logged exceptions (see Exceptions in the Event View Panel).
See Also
AQTime Profilers
Find the Routine Where an Exception Occurred
Possible Problems with the Call Stack
Exceptions in the Event View Panel
Profiling .NET Applications - Specifics

 General Information