
Microsoft SQL Server 2005 hosts .NET Framework and provides developers with the possibility to create stored procedures, triggers and functions in C# .NET, Visual Basic .NET and Visual C++ .NET. The created assemblies are uploaded to SQL Server and stored in system catalogs. You can then create special database objects such as functions, procedures, triggers, types and aggregates, that will connect to the assemblies and call the CLR routines. For instance, you can create a Transact-SQL query that will call a routine from a CLR integration assembly the same way it calls other Transact-SQL functions.
For detailed information on creating CLR integration assemblies for Microsoft SQL Server, see the Database Engine .NET Framework Programming section of the MSDN Library (the on-line version is available at http://msdn.microsoft.com).
 Key Points
Key Points
Profiling of CLR integration assemblies with AQTime has the following specifics:
-
First of all, you should launch SQL Server from AQTime. The CLR integration assemblies are loaded in memory by the SQL Server process, and you cannot use the “attach to process” feature to connect the profiler to this process, because this feature does not support profiling of managed code. So, you have to start SQL Server from AQTime.
-
To launch SQL Server, you should use certain run parameters in your AQTime project.
-
Another important point is to select the Entire .NET Code area in the Setup panel.
The problem is that AQTime is unable to determine the module name of your integration assembly when this assembly is loaded by SQL Server. This happens due to certain peculiarities of SQL Server. Since the module name cannot be determined, the profiling area settings will not function. So, if you do not check the Entire .NET Code box, AQTime will be unable to find the routines for profiling and you will get empty results.
Since the module name cannot be determined, triggers and actions that contain routines defined in your assembly will also be ineffective. So, do not forget to set the Initial Profiling Status setting to ON in the Setup panel. If it is off, the triggers and actions will not be active during the run.
-
In order for AQTime to be able to trace the execution of your assembly’s functions, you should change the security settings of your database. To do this, you should execute specific SQL code (see below).
-
Finally, to obtain profiling results, you should use the Get Results command (see Getting Results During Profiling).
Below is a step-by-step description of how to profile SQL Server CLR integration assemblies.
Requirements
The CLR integration assemblies operate on the SQL Server computer. So, to profile them, you should install AQTime on this computer.
Upload your assembly to the server and register it in system catalogs. For more information on how to perform these actions, see the MSDN Library.
Before profiling your CLR integration assembly, test it in SQL Server Management Studio and ensure that the assembly functions as expected when it is not being profiled by AQTime.
1. Changing Database Security Settings
To modify the security settings, we will create and use a temporary query:
-
Open SQL Server Management Studio and connect to the SQL Server instance that controls your database.
-
Create a new empty query. To do this, choose File > New > Query with Current Connection from the Management Studio’s main menu.
-
Type the following code into the query editor:
Transact-SQL
sp_configure 'show advanced options', 1;
GO
RECONFIGURE;
GO
sp_configure 'clr enabled', 1;
GO
RECONFIGURE;
GO -
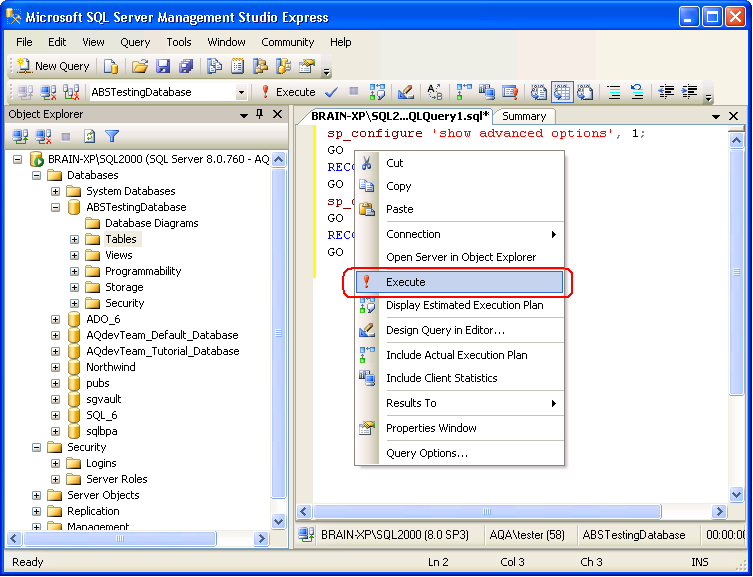
Execute the query. You can do this by right-clicking somewhere within the query editor and selecting Execute from the context menu.
-
Clear the query code and type the following lines:
Transact-SQL
ALTER DATABASE Database_Name SET TRUSTWORTHY ON;
GOHere, Database_Name stands for the name of your database. For instance,
Transact-SQL
ALTER DATABASE AdventureWorks SET TRUSTWORTHY ON;
GO -
Choose Execute from the context menu to execute this query.
-
Clear the query code once again and type the following text:
Transact-SQL
USE Database_Name
ALTER ASSEMBLY Assembly_Name WITH permission_set = UnSafe
GOHere, Database_Name stands for the name of your database and Assembly_Name is the file name of your assembly that implements the stored procedure functionality. You should specify the file name without the path and extension:
Transact-SQL
USE AdventureWorks
ALTER ASSEMBLY HelloWorld WITH permission_set = UnSafe
GO -
Execute this code.
-
Close the query editor. Answer No when the SQL Server Management Studio asks you to save the changes to the query.
2. Setting AQTime Project
-
Launch AQTime and add the desired assembly to your AQTime project.
-
Select the Entire .NET Code check box in the Setup panel.

It is important that you select Entire .NET Code. Due to certain peculiarities of SQL Server, AQTime is unable to determine the module name of your SQL Server extension and the profiling area settings will not work. If you do not check the Entire .NET Code box, you will get empty results. -
In the Triggers and Actions section of the Setup panel, set the Initial Profiling Status for All Threads option to ON.
Note: The requirement to enable the initial profiling status is caused by the fact that it is unable to determine the module name. When the module name cannot be determined, AQTime is unable to recognize the executed routines properly. So, the triggers and actions that contain the routines defined in your integration assembly, will not work. They will not turn the profiling on, if the initial profiling status is off.
Now we have to specify the run mode and run parameters:
-
We will run the profiler in
 Normal mode. Select this mode from AQTime’s Standard toolbar.Select this mode from Visual Studio’s AQTime toolbar.Select this mode from Embarcadero RAD Studio’s AQTime Profiling Modes toolbar.
 -
Choose Run > Parameters from AQTime’s main menu. Choose AQTime > Parameters from Visual Studio’s main menu. Choose AQTime > Parameters from Embarcadero RAD Studio’s main menu.
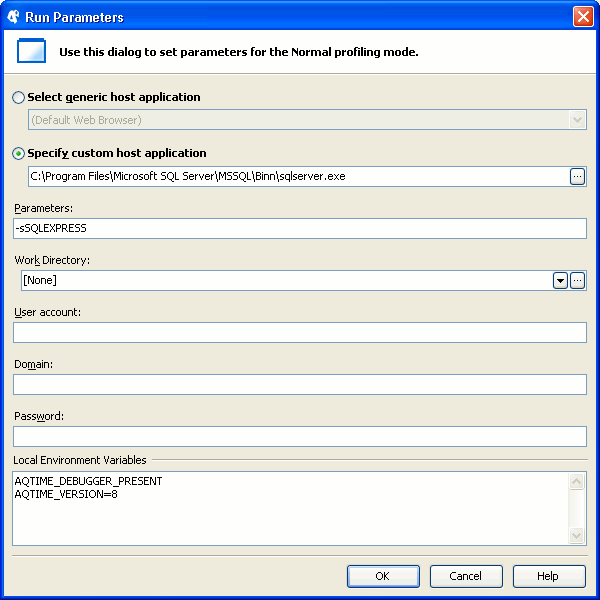
This will invoke the Run Parameters Dialog (for Normal Mode). Specify the following values in this dialog:
-
In the Specify custom host application box, specify the path to the <Program Files>/Microsoft SQL Server/MSSQL/Binn/sqlservr.exe module.
-
In the Parameters box specify the -s command-line argument followed by the server name. Typically, you should type -sMSSQLSERVER, if you use Microsoft SQL Server 2005, or -sSQLEXPRESS, if you use Microsoft SQL Server Express Edition.
-
-
Press OK to save the changes.
3. The Profiler Run
Prepare for the run:
-
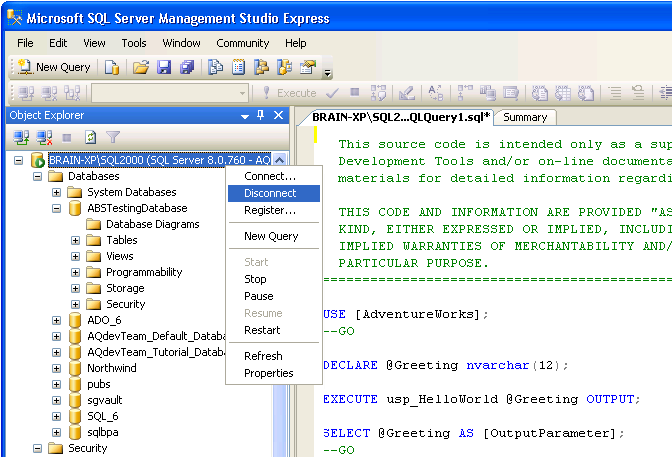
Disconnect SQL Server Management Studio and all queries from your SQL Server instance:
-
Open the Object Explorer panel of SQL Server Management Studio.
-
Right-click the server node and choose Disconnect from the context menu.
-
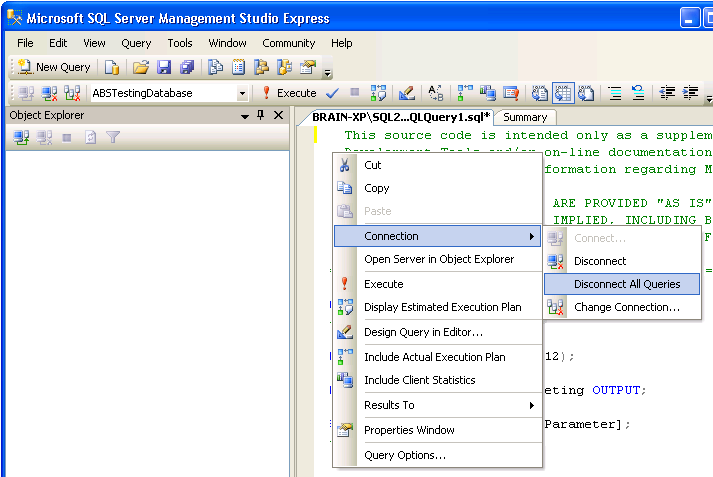
If you have queries that are open in the Management Studio and that are connected to the server, then you should disconnect these queries. To do this, right-click somewhere within a query editor and choose Connections > Disconnect All Queries from the context menu.
-
-
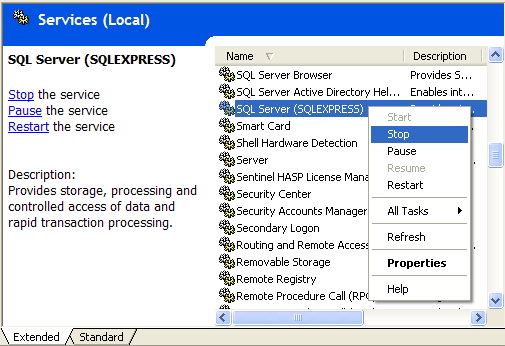
Stop the SQL Server service:
-
Open the Control Panel > Administrative Tools > Services window.
-
Right-click the SQL Server (SQLSERVER2005) item (SQL Server (SQLEXPRESS) if your are running SQL Server Express Edition) and choose Stop from the context menu.
-
-
Switch to AQTime. Switch to Visual Studio. Switch to Embarcadero RAD Studio. Check that Normal mode is selected and that the project is prepared as it is described above.
Now we can run the profiler:
-
Start profiling as you normally would.
-
Switch to SQL Server Management Studio and open the SQL code, which calls the routines from your CLR integration assembly, in it.
-
Right-click the SQL code in the editor and choose Connection > Change Connection from the context menu.
In the ensuing dialog, connect to your SQL Server instance.
-
Right-click within the editor and choose Execute from the context menu. This will execute the SQL code.
-
To generate profiling results, choose the Run > Get Results item from AQTime’s main menu or press
 Get Results on the Standard toolbar. To generate profiling results, choose the AQTime > Get Results item from Visual Studio’s main menu or press Get Results on the AQTime toolbar. To generate profiling results, select AQTime > Get Results from RAD Studio’s main menu.
 AQTime will display the results in its panels.
To terminate the profiler run:
-
Disconnect all queries from the SQL Server.
-
To stop the profiler, click
 Terminate on the Standard toolbar.select AQTime > Terminate from Visual Studio’s main menu.select AQTime > Terminate from RAD Studio’s main menu.
Since we selected the Entire .NET Code box, the profiling results contain all managed routines that were executed during the profiler run. To find the routines that belong to your assembly, you can group results by class name. You can also sort results to find the desired routines faster.
You will find that the Module Name column does not display any values for your routines. This happens because the module name cannot be determined.
Do not forget to start the SQL Server service after you finish the profiling sessions:
-
You can do this in the Control Panel > Administrative Tools > Services window.
-
Right-click the service in the window and choose Start from the context menu.
See Also
Profiling Various Applications and Code
Profiling .NET Applications - Specifics