DéjàClick has been extended to include browser-related events and page-render timings in addition to the existing network timings as it loads pages into the browser. The browser-related timings – DOM Load and Page Load – are standard and included in several existing AlertSite performance reports.
The page-render timings, First Paint and Above the Fold, reflect perceived user experience and is an option that can be displayed in the detail report for a single transaction. These timings consume one usage credit for each action in the transaction, and provide screenshots at each stage.
| Note: | The page-render timing option is available in DéjàClick Version 2.4.3.1 and later. |
Standard user experience reporting
DéjàClick includes browser-related events in addition to the existing network timings as it loads pages into the browser.
These metrics are described as:
| DOM Load | The time it took to complete parsing the page’s documents. | ||
| Page Load |
The time it took for the page’s documents (all referenced objects, scripts, style-sheets, and images) to be fully loaded into the browser.
|
The DOM, or Document Object Model, defines a standard way for accessing and manipulating HTML documents and presents an HTML document as a tree structure. This manipulation, or parsing, occurs behind the scenes. The elements of the page – for example, other documents, text, iFrames, and so on – are assembled before they are loaded. Here is a figurative example of a DOM:
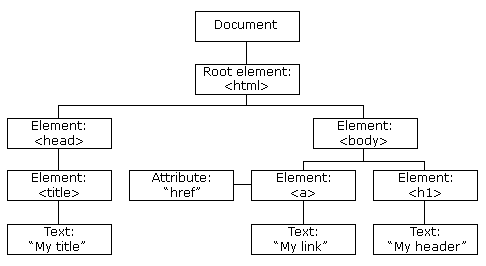
The DOM Load time measurement represents the amount of time it took to assemble these elements. Technically, the timer starts when the first element is accessed and stops when the DOMContentLoaded event handler is executed.
The Page Load time measurement represents the amount of time it took for the entire page and all of its related files and components to be loaded in the browser window, that is, ready for visitor interaction. Technically, the timer starts when the first element starts loading into the browser and stops when the browser OnLoad event handler is executed.
These metrics are useful for understanding what visitors to your website are actually experiencing in real time, and not just the network latencies that are happening in the background.
The new columns appear on the right side of the affected reports, highlighted in light blue.
The following reports display the new columns:
- Detail Report
- DéjàClick Action Detail Report
- DéjàClick Event Detail Report
- Transaction Step Summary
- Transaction Detail Report
The "waterfall" graph of the HTTP step report and fullpage report have been enhanced to display a blue reference line for DOM load and a red reference line for page load.
For additional flexibility, a new option, User Experience Settings, appears in the monitor settings page to provide base page timings only. By default, this option is enabled so that reports show event timings for the base page only, not the cumulative timings for the entire page (including sub-frames).
Perceived user experience reporting
 |
The perceived user experience reporting feature is available in DéjàClick for Mozilla Firefox only. |
You can collect additional user experience information with first paint and above the fold timing
-
First paint – The time it takes for the page to start rendering.
-
Above the fold – The time it takes for all visible content rendered on the page to "stabilize".
Configure DéjàClick and AlertSite
To include the perceived user experience data in your reports, you need to configure DéjàClick in the following way:
 |
This feature is currently available only in DéjàClick for Firefox. |
-
If the DéjàClick toolbar is shut down, power it on by clicking the leftmost icon (
 ).
).
-
Create a recording as usual.
-
Click the replay icon (
 ) to replay the recording and verify everything is OK.
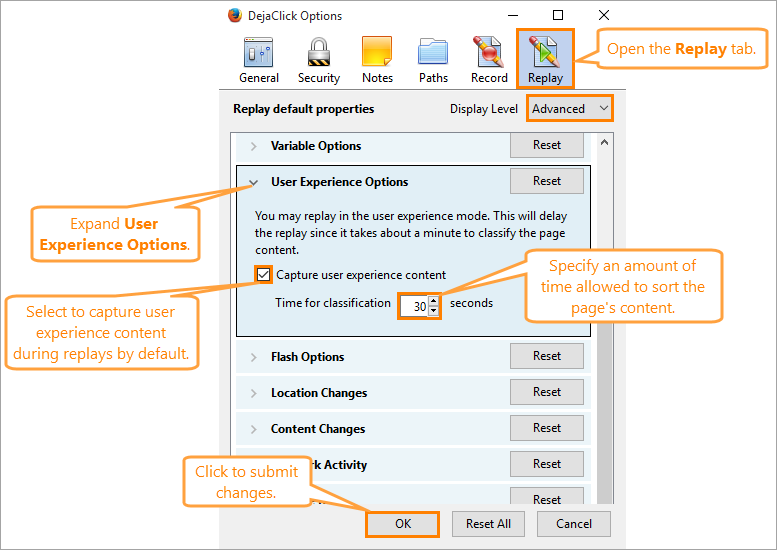
Note: If any timeout issues occur, use the Replay Advisor to solve these automatically. To allow DéjàClick gather user experience data during the replay, select
 > Quick Settings > Replay for User Experience.
-
Click the replay icon once again.
-
The Screen Size Adjust dialog appears, informing you about the necessity to adjust the browser window. Allow it to perform adjustment.
-
Wait until the replay finishes. It may take some time depending on how many objects there are on the page.
Note: DéjàClick will automatically treat objects as dynamic or static content. It would not wait until dynamic objects stabilize. -
After the replay finishes, upload the recording. To do that, select
 >Upload Recording.
| Note: | You can change the amount of time the DéjàClick takes to classify objects. To do that, select |
The newly uploaded recording will appear in AlertSite as a new monitor automatically. To prepare it for reporting, you need to do the following:
AlertSite UXM
-
On the Dashboard, click on the monitor tile and select Edit Configurations.
–or–
Click Edit Monitor on the Monitor Summary, Monitor Availability, or Monitor Performance dashboard.
-
Switch to the Advanced tab, select the Enable UX check box in the User Experience section.
Note: This option will consume 0.5 additional usage credits for every action in the transaction while enabled. -
Select the Show Only Root Page UX Values check box. This will collect timings only for the base page without frames.
-
Click Save.
AlertSite 1.0
-
On the Dashboard > Devices screen, find your new monitor and click the wrench icon next to it to open the monitor settings screen.
-
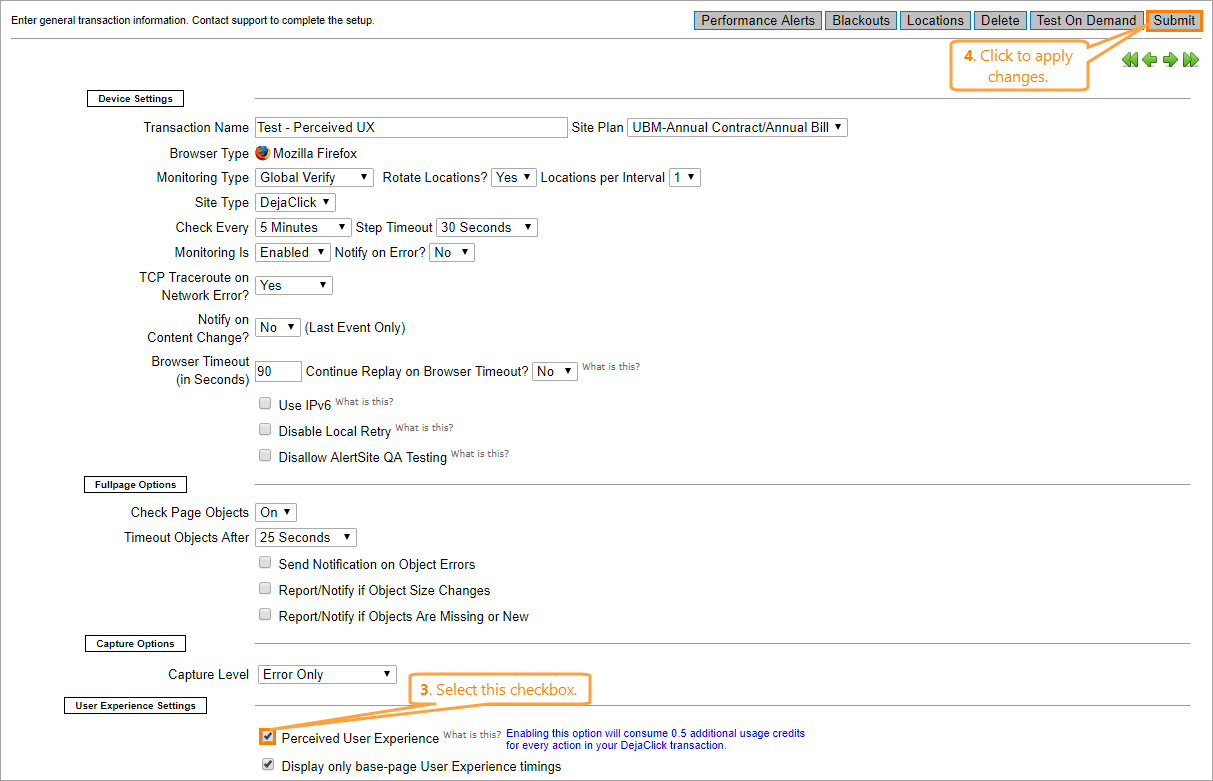
On the monitor settings screen, select the Perceived User Experience check box in the User Experience Settings section.
Note: This option will consume 0.5 additional usage credits for every action in the transaction while enabled. -
Click Submit.
Now your DéjàClick and AlertSite applications will collect all necessary perceived user experience data which you can include in your reports.
Include perceived user experience timings in reports
To include the collected data in reports, do the following:
AlertSite UXM
-
From the top menu, select Reports > Performance Reports.
-
Select Detail from the Select Report Type drop-down list.
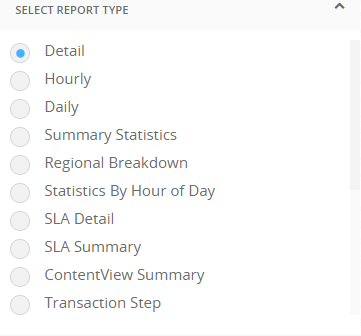
-
From the Select Monitors list, select the monitor created from the transaction you have uploaded.
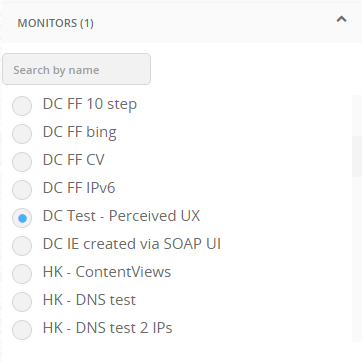
-
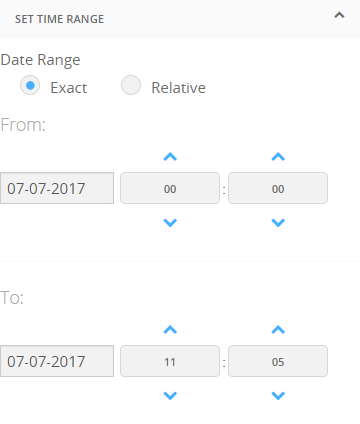
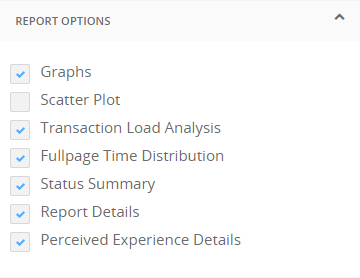
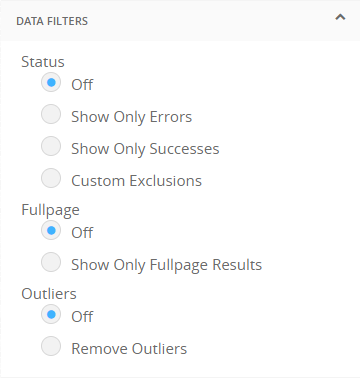
Specify the report parameters – locations, date range, and any filters you want to apply – in Select Locations, Set Time Range, Report Options, and Data Filters.
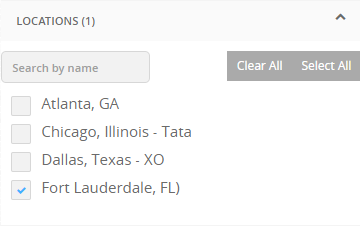
-
Click Run Report.
Note: If you have not played back the recording in DéjàClick with the Replay for User Experience option enabled, the collected data may not be reported accurately.
AlertSite 1.0
-
If using AlertSite UXM, switch to AlertSite 1.0 by selecting > AlertSite 1.0 from the top menu.
-
From the top menu, select Reports > Performance Reports.
-
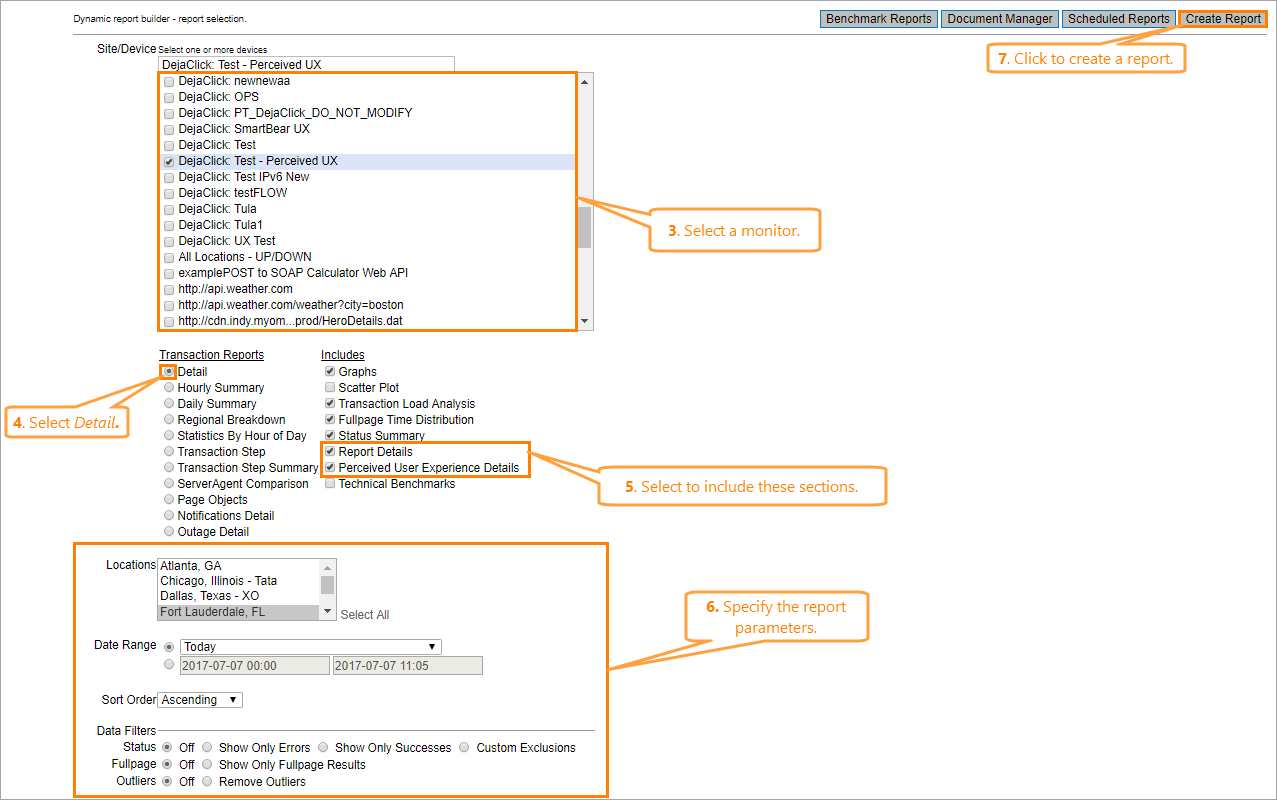
From the Site/Device list, select the monitor created from the transaction you have uploaded.
Tip: The perceived user experience data is available only for a single transaction report. -
In the transaction Transaction Reports list, select Detail.
-
In the Include list, select Report Details and Perceived User Experience Details.

If the Perceived User Experience Details is not specified, make sure you have selected the Perceived User Experience check box on that monitor’s settings screen. -
Specify the report parameters – locations, date range, and any filters you want to apply.
-
Click Create Report.
Note: If you have not replayed the recording in DéjàClick with the Replay for User Experience option enabled, the collected data may not be reported accurately.
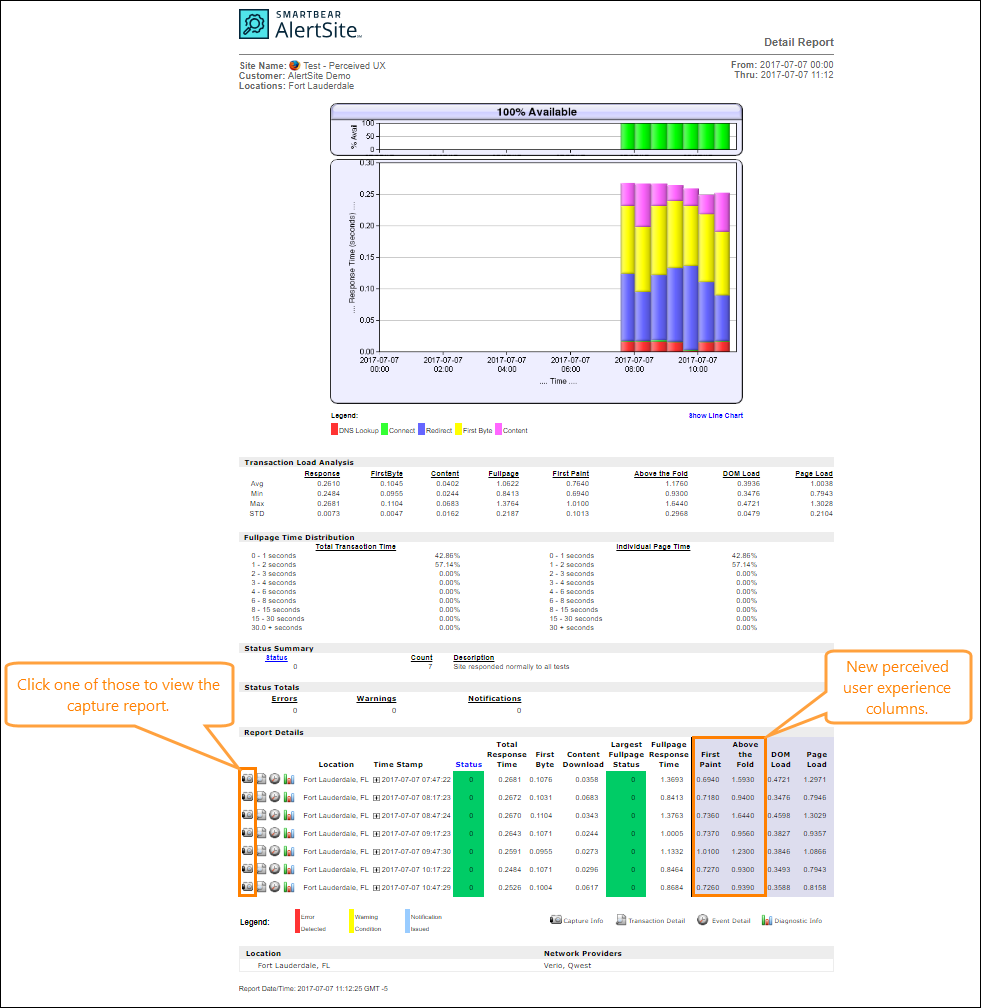
After the report is generated, click View to display it in your browser:
In the Report Details, two additional columns have appeared: First Paint and Above the Fold. As for network timings (DNS time, connect time, and redirect time), these have been removed.
You can watch the capture report by clicking the camera icon near the specific monitor in the Report Details section. Click it to view how the page looked like at the first paint and above the fold.
| Note: | You may also want to create a usage report which shows how many credits you have spent to perform transactions in the specified time period. |
See Also
Creating Transaction Monitors in Firefox
Download and Upload DéjàClick Scripts
Transaction Monitors


