TestComplete samples (both built-in and additional) are located in the <Users>\Public\Public Documents\TestComplete 14 Samples folder.
Some file managers display the Public Documents folder as Documents.
About AQtime Integration
AQtime is a multi-purpose profiling toolkit for 32-bit and 64-bit Windows, .NET, Java and Silverlight applications, JScript and VBScript code. It allows developers to pinpoint application performance bottlenecks, memory and resource leaks, trace exceptions, measure code coverage and other characteristics. AQtime can run standalone and can be integrated into Microsoft Visual Studio and Embarcadero RAD Studio for seamless developer experience. If you are interested in trying AQtime, download a free AQtime trial and see if it meets your needs:
 https://smartbear.com/aqtime/free-trial
The procedure of application profiling with AQtime is similar to application testing: you start the application, perform some operations in it (navigate between the application’s forms, enter data, execute menu and toolbar commands and so on). AQtime tracks the selected characteristics - performance, memory usage, code coverage and so on - throughout the profiling session and generates reports on demand and after the application is closed.
To free you from having to manually interact with the application during profiling, TestComplete is integrated with AQtime. This allows you to profile your application automatically while the application is being controlled by TestComplete tests. The rest of this topic explains how this can be done.
TestComplete is integrated with AQtime in two ways:
-
Via the Profile run mode of the tested application. In this mode, profiling starts automatically when the tested application is launched. The profiling settings are specified in the tested application's properties.
-
Via special scripting objects used to work with AQtime from tests. In this case, you launch AQtime, specify the profiling settings and attach it to your tested application directly from your test.
Both approaches are explained in detail below.
Requirements
-
In order for AQtime to be able to profile your tested application, the application must be compiled with debug information. Please see AQtime documentation for more information on this.
-
To use the AQtime integration, run TestComplete with administrator permissions.
Running Tested Applications in Profile Mode
You can set the Profiler run mode and specific settings for a tested application so that when you command TestComplete to launch a tested application, it will launch it under AQtime using the specified AQtime profiler. AQtime will perform profiling and TestComplete will perform various testing actions (for instance, simulate user actions over the tested application). By using this tandem, you can, for example, perform Coverage profiling and test your application at the same time.
This approach is supported for AQtime versions 4.7 - 8.x.
You can set up the tested application parameters either in the TestedApps editor, or in script code.
Configuring Profiling Settings in the TestedApps Editor
To set up the tested application parameters in the editor:
-
Open the TestedApps editor. To do this, double-click the TestedApps item in the Project Explorer.
-
In the editor, select the tested application you are going to test and profile.

The Profile run mode is only supported for generic Windows applications. It is not supported for Windows Store, Java, Web, AIR, ClickOnce, and mobile applications. -
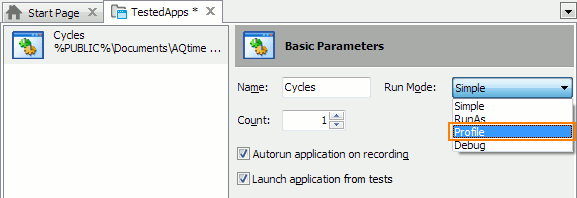
In the Basic Parameters section, in the left part of the editor, set Run Mode to Profile.

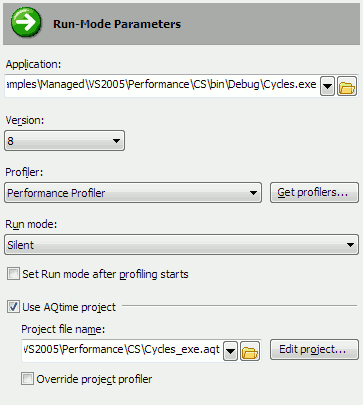
TestComplete will display the tested application settings specific to the Profile run mode.

-
If you have multiple versions of AQtime installed, select the needed version from the Version combo box.
-
If you have an AQtime project configured for application profiling, select the Use AQtime project option and specify the Project file name. To view or modify this project in AQtime, click Edit project.
If you do not specify an AQtime project, TestComplete will create a temporary project that will be deleted after the profiling is over.
-
In the Profiler combo box, select the desired AQtime profiler.
When using the Use AQtime project option, the profiler selection is ignored and TestComplete uses the profiler selected in the AQtime project. If you want to use a different profiler, select Override project profiler and choose the needed profiler from the Profiler combo box.
-
Select File | Save from the TestComplete main menu to save the changes.
For more information about the settings available in the Profile run mode, see Profile Mode Parameters.
Configuring Profiling Settings From Tests
With TestComplete, you can also set up the run mode parameters from script code. Use the TestedApp.Params.ProfileParams property to obtain the TestedAppProfileParams object that provides scripting interface to parameters of the Profile mode. The following code demonstrates how you can set up parameters from scripts. For information on properties used, see description of the TestedAppProfileParams object:
JavaScript, JScript
var MyApp;
// Obtain the tested application
MyApp = TestedApps.MyTestedApp;
// Specify the run mode parameters
MyApp.Params.ProfileParams.AQtimeVersion = 8;
MyApp.Params.ProfileParams.ProfilerName = "Coverage Profiler";
MyApp.Params.ProfileParams.RunMode = "Normal";
MyApp.Params.ProfileParams.UseProject = false;
// Activate the Profile run mode
MyApp.Params.ProfileParams.Activate();
// ...
Python
# Obtain the tested application
MyApp = TestedApps.MyTestedApp

# Specify the run mode parameters
MyApp.Params.ProfileParams.AQtimeVersion = 8
MyApp.Params.ProfileParams.ProfilerName = "Coverage Profiler"
MyApp.Params.ProfileParams.RunMode = "Normal"
MyApp.Params.ProfileParams.UseProject = False

# Activate the Profile run mode
MyApp.Params.ProfileParams.Activate()

# ...
VBScript
' Obtain the tested application
Set MyApp = TestedApps.MyTestedApp
' Specify the run mode parameters
MyApp.Params.ProfileParams.AQtimeVersion = 8
MyApp.Params.ProfileParams.ProfilerName = "Coverage Profiler"
MyApp.Params.ProfileParams.RunMode = "Normal"
MyApp.Params.ProfileParams.UseProject = False
' Activate the Profile run mode
MyApp.Params.ProfileParams.Activate
' ...
DelphiScript
var
MyApp : OleVariant;
begin
// Obtain the tested application
MyApp := TestedApps.MyTestedApp;
// Specify the run mode parameters
MyApp.Params.ProfileParams.AQtimeVersion := 8;
MyApp.Params.ProfileParams.ProfilerName := 'Coverage Profiler';
MyApp.Params.ProfileParams.RunMode := 'Normal';
MyApp.Params.ProfileParams.UseProject := False;
// Activate the Profile run mode
MyApp.Params.ProfileParams.Activate;
// ...
end;
C++Script, C#Script
var MyApp;
// Obtain the tested application
MyApp = TestedApps["MyTestedApp"];
// Specify the run mode parameters
MyApp["Params"]["ProfileParams"]["AQtimeVersion"] = 8;
MyApp["Params"]["ProfileParams"]["ProfilerName"] = "Coverage Profiler";
MyApp["Params"]["ProfileParams"]["RunMode"] = "Normal";
MyApp["Params"]["ProfileParams"]["UseProject"] = false;
// Activate the Profile run mode
MyApp["Params"]["ProfileParams"]["Activate"]();
// ...
Automating the Profiling Session
After you set the Profile run mode for the application and specify the run parameters, TestComplete will launch the application in AQtime when you run the application from tests of from the TestComplete IDE.
Note that when you launch an application in the Profile mode by using the TestedApp.Run method, the method returns the AQtime object rather than the Process object. Use the AQtime object to control the profiling process.
To simulate user actions over the profiled application, obtain the application’s process. To do this, use the Sys.Process or Sys.WaitProcess method.
Using Special Program Objects
TestComplete includes several objects to work with AQtime:
-
The
AQtimeIntegrationobject is used to specify what AQtime version will be used for testing. -
The
AQtimeobject provides a scripting interface to the functionality of AQtime 4.7 and later. This object contains methods that let you start AQtime, select the desired profiler and so on. It supports all AQtime profilers.
Use the methods and properties of these objects to specify an application you want to profile, select the desired profiler and configure other profiling settings.
To start profiling, use the AQtime.StartProfiling method. Note that when you start profiling with AQtime, the application to be profiled is typically launched by AQtime. There is no need to launch it from the TestComplete IDE of from tests. To avoid confusions between several instances of the same application, it is recommended to comment all test commands that run the application to be profiled in your tests.
Getting Profiling Results
A profiling session in AQtime lasts until the application is closed or until you terminate the profiling process from the AQtime IDE or by calling the appropriate methods of the TestComplete AQtime object. The profiling results are generated when the tested application is closed or when you command AQtime to generate the results. You can command AQtime to generate the results by using AQtime’s menu items or by calling the AQtime.GetResults method from TestComplete tests.
By default, the profiling results are not imported to TestComplete. After the test execution is over and the profiling session is closed, you get two result sets: one in TestComplete and another in AQtime. To make AQtime results available from TestComplete, you can export AQtime results to a file and post the link to the file to the TestComplete log: this way the profiling results will be saved along with the test results.
The following script code demonstrates a typical procedure that starts a tested application in the Profile mode, simulates user actions against the application while AQtime is performing profiling and posts the profiling results to the TestComplete test log:
JavaScript, JScript
function Test()
{
// Launch the tested application and obtain the AQtime object
var AQtimeObj = TestedApps.MyApp.Run();
// Simulate user actions against the application
var p = Sys.Process("MyApp");
var w = p.Window("MainFrmClass", "*", 1);
w.Activate();
// …
AQtime.ClearResults();
// …
// Close the tested application
// (by default, this also terminates profiling in AQtime)
p.Close();
// Wait until AQtime finishes profiling and export the results
AQtimeObj.WaitAndExportResults("C:\\SummaryResultsFile.xml", "C:\\ResultsFile.xml");
}
Python
def Test():

  # Launch the tested application and obtain the AQtime object
  AQtimeObj = TestedApps.MyApp.Run()

  # Simulate user actions against the application
  p = Sys.Process("MyApp")
  w = p.Window("MainFrmClass", "*", 1)
  w.Activate()
  # ...
  AQtime.ClearResults()
  # ...
  # Close the tested application
  # (by default, this also terminates profiling in AQtime)
  p.Close()

  # Wait until AQtime finishes profiling and export the results
  AQtimeObj.WaitAndExportResults("C:\\SummaryResultsFile.xml", "C:\\ResultsFile.xml")
VBScript
Sub Test
' Launch the tested application and obtain the AQtime object
Set AQtimeObj = TestedApps.MyApp.Run
' Simulate user actions against the application
Set p = Sys.Process("MyApp")
Set w = p.Window("MainFrmClass", "*", 1)
w.Activate
' …
Call AQtime.ClearResults
' …
' Close the tested application
' (by default, this also terminates profiling in AQtime)
p.Close
' Wait until AQtime finishes profiling and export the results
Call AQtimeObj.WaitAndExportResults("C:\SummaryResultsFile.xml", "C:\ResultsFile.xml")
End Sub
DelphiScript
procedure Test();
var AQtimeObj, p, w : OleVariant;
begin
// Launch the tested application and obtain the AQtime object
AQtimeObj := TestedApps.MyApp.Run;
// Simulate user actions against the application
p := Sys.Process('MyApp');
w := p.Window('MainFrmClass', '*', 1);
w.Activate;
// …
AQtime.ClearResults();
// …
// Close the tested application
// (by default, this also terminates profiling in AQtime)
p.Close;
// Wait until AQtime finishes profiling and export the results
AQtimeObj.WaitAndExportResults('C:\SummaryResultsFile.xml', 'C:\ResultsFile.xml');
end;
C++Script, C#Script
function Test()
{
// Launch the tested application and obtain the AQtime object
var AQtimeObj = TestedApps["MyApp"]["Run"]();
// Simulate user actions against the application
var p = Sys["Process"]("MyApp");
var w = p["Window"]("MainFrmClass", "*", 1);
w["Activate"]();
// …
AQtime["ClearResults"]();
// …
// Close the tested application
// (by default, this also terminates profiling in AQtime)
p["Close"]();
// Wait until AQtime finishes profiling and export the results
AQtimeObj["WaitAndExportResults"]("C:\\SummaryResultsFile.xml", "C:\\ResultsFile.xml");
}
To wait for profiling to finish and to export profiling results, you can use the AQtime.WaitAndExportResults method. This method saves brief and full results to two files and posts the file links to the test log:

To clear the results of the current profiling session, use the AQtime.ClearResults method. It removes the gathered results. You can use this method to profile a specific part of your application. For example, you can clear the results before running test operations for the part you want to profile.
Samples
For an example of working with AQtime by using the AQtimeIntegration and AQtime scripting objects, see the following topic:
 Integration With AQtime Using the AQtimeIntegration and AQtime Objects
The following sample project demonstrates how you can profile an application by using the Profile mode:
 <TestComplete Samples>\Desktop\Coverage Testing
 |
If you do not have the sample, download the TestComplete Samples installation package from the https://support.smartbear.com/downloads/testcomplete/samples/ page of our website and run it. |
