In TestComplete, tests may call each other. For instance, a keyword test may call a script routine or other keyword tests. The call sequences may be rather long and include several levels. If an error occurred somewhere in the test it may be difficult to determine what caused it. You may double-click the problem message in the test log and jump to the keyword test operation or script statement that posted this message to the log (see Generic Test Log - Test Log Panel). In addition to this feature, TestComplete offers one more instrument to help you better understand what caused the problem: the call stack of executed tests.
During the test run, the test engine detects and logs the sequence of tests that led to posting a message to the test log. This sequence is then displayed in the Call Stack panel of the log. Using this information you can analyze the execution sequence of your tests and better understand what happened in your project during the run. You can view the tests listed in the call stack by simply double-clicking these tests in the log. TestComplete will open the test for editing and highlight the call line.
By default, this functionality is enabled for error messages only and disabled for messages of other types. You can enable it for other messages by using the Log.CallStackSettings object. This object contains properties that enable or disable call stack tracing for any available message type. For instance, the following code snippet demonstrates how to enable the call stack tracing for messages of the warning type:
JavaScript, JScript
Log.CallStackSettings.EnableStackOnWarning = true;
Python
Log.CallStackSettings.EnableStackOnWarning = TrueVBScript
Log.CallStackSettings.EnableStackOnWarning = True
DelphiScript
Log.CallStackSettings.EnableStackOnWarning := true;
C++Script, C#Script
Log["CallStackSettings"]["EnableStackOnWarning"] = true;
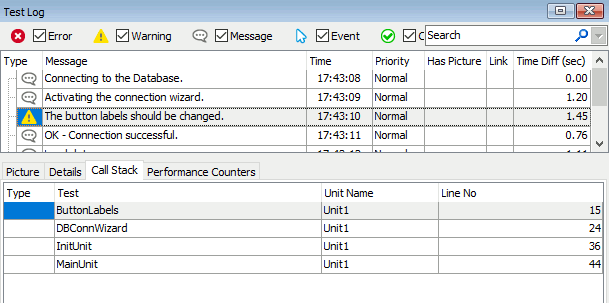
After this line is executed, the test engine will accumulate call stack data for each warning message that you post to the log. This information will be displayed in the log’s Call Stack panel for the message:

The panel displays the sequence of executed keyword tests and script routines that led to posting the selected message. You can easily open the test or script for editing by double-clicking it in the Call Stack list.
Notes:
-
Quite often tests post a lot of messages to the test log and if the call stack tracing is enabled, the call stack data may significantly increase the size of the log files. So, we do not recommend that you enable this feature for all message types. You may even disable the call stack tracing for error messages and enable it only when it is needed through the
Log.CallStackSettings.EnableStackOnErrorproperty. -
The changes you made to the call stack settings only effect one test run, if you run the test from its editor or from the Project Explorer panel.
If you run the test as a test item, the changes made to the call stack settings within this test only have effect during the test item execution.
See Also
Posting Messages, Images and Files to the Log
Generic Test Log - Call Stack Panel
Log.CallStackSettings Property
CallStackSettings Object
