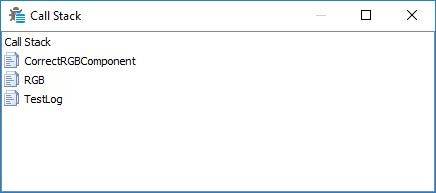
The Call Stack panel lists the sequence of script routine calls and keyword tests that led to the current execution point.
The following image displays an overall view of the Call Stack panel:

Displaying the Panel
By default, the Call Stack panel resides at the bottom of the Workspace panel. If the panel is hidden, you can do one of the following to display it:
-
Click the
 button
on the Debug toolbar.
 -
Press the View | Debug | Call Stack shortcut. The default shortcut depends on the keyboard mapping scheme chosen in the Customize Keyboard dialog. For the Visual Studio Emulation scheme, it is Alt+7. For the Borland Classic and Default schemes, it is Ctrl+Alt+S. You can also change the assigned shortcut via the Customize Keyboard dialog.
-
Select View | Debug | Call Stack from the main menu.
-
Choose View | Select Panel from the TestComplete main menu and then choose Call Stack from the ensuing Select Panel dialog.
Information on the Panel
Each row in the panel corresponds to a script call or to a keyword test run. The topmost row corresponds to the last called routine or the last executed test and the bottomost row corresponds to the earliest call or test (that is, the routine or keyword test from which the test run started). Each entry includes the name of the routine or keyword test and the parameter values passed to it.
TestComplete allows you to customize the layout of any of its panels to better meet your needs. For example, you can change the panel’s size, docking and position, hide the panel or make it visible. To learn how to customize the TestComplete interface, see Customizing TestComplete.
Working with the Panel
To jump to a source code
To jump to a script routine or a keyword test that in shown in the Call Stack panel, do any of the following:
-
Right-click the row that corresponds to the desired routine or test in the Call Stack panel and then select
 Show Source from the context menu.
 -
Select the desired row in the Call Stack panel and press Enter.
-
Double-click the row.
TestComplete will display the script routine code (or the contents of the keyword test) and the cursor will be on the last executed line of the chosen script routine (or on the last executed operation of the test).
To add breakpoints
To add a breakpoint to a script routine or a keyword test which is shown in the Call Stack panel, do the following:
- Right-click the row that corresponds to the desired routine or test in the Call Stack panel and select Insert Breakpoint from the context menu.
TestComplete will set a breakpoint on the line (or operation) that follows the last executed line of the selected script routine (or follows the last executed operation of the selected test).
To run tests to a specified point
To continue the test execution until it reaches the specified point:
- Right-click the row that corresponds to the desired script routine or test in the Call Stack panel and select Run to Cursor from the context menu.
TestComplete will continue executing the test until it reaches the line (or operation) that follows the last executed line of the selected script routine (or the last executed operation of the selected test).
See Also
Debugging Tests - Overview
Using Breakpoints
Running Tests
Running to the Cursor

 To jump to a source code