
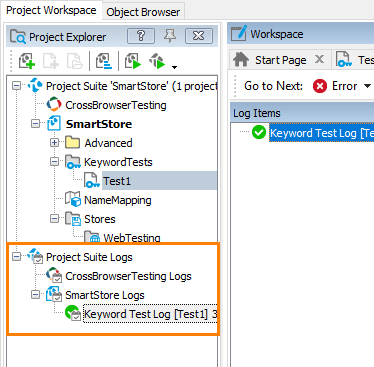
TestComplete keeps a complete log of all operations performed during testing. The Project Explorer keeps the test results under the Project Suite Logs > SmartStore Log node. This is where you are viewing the test history of the project and project suite. Each node corresponds to a test run. An icon to the left of the node shows whether the corresponding test run passed successfully:
TestComplete adds nodes for the last results automatically after the test execution is over. It does not display the results when the test is running (you can view intermediate results if you pause the test execution).
Because we have run only one test so far, we have only one log node in the Project Explorer. By default, TestComplete automatically opens that log. To open a test log manually, double-click the needed log node in the Project Explorer panel.
| Note: | By default, TestComplete stores all test results in log files. The number of the log files will grow with every test run, and this will result in the memory consumption increase. To reduce memory usage, you can delete files from the log manually or limit the number of log files to be kept. |
In our example, the log is as follows –

The log window shows the results of one test run at a time. On the left side of the window, there is a tree-like structure of the executed tests; you can select each of them to view their results. We have run only one test, so in our case this tree only contains one node. The node icon indicates whether the test passed successfully or failed.
The test log contains error, warning, informative, and other types of messages. The icon on the left indicates the message type. With the check boxes at the top of the message list, you can hide or view messages by type.
For each message, the log also shows the time that each action was performed. You can see it in the Time column.
TestComplete may post additional text and images along with the message. To view them, select the desired message in the log and look in the Additional Info and Picture panes that are below the message list.
The Picture panel shows the images of the expected and the actual application state when executing the selected test command: the “Expected” image was captured for the command during the test recording, the “Actual” image was captured during the test run. You can click  View Comparison Results to compare the images and easily see the difference. This simplifies the search for errors that may occur in your test. For more information, see the topics of the Test Visualizer section.
The Call Stack pane displays the hierarchy of test calls that led to posting the selected message to the log. As we have run only one test that has not called other tests, the panel is empty.
The Performance Counters pane displays values of the performance counters monitored during the test run. The values are shown in the form of graphs. As we have not configured any performance counters, the panel is empty, as well.
To view a test operation that posted a message to the log, double-click the desired message in the log. TestComplete will open the keyword test in the editor and highlight the appropriate operation. For instance, if you double-click the “The button was clicked with the left mouse button.” message in the log, TestComplete will highlight the keyword test operation that performed this action:

For detailed information on the test log panels, on posting messages to the log and on working with the results, see the About Test Log section.
| Note: | The log that we described is typical for TestComplete keyword tests and scripts. Tests of other types may form a log of a different structure. For detailed information about these logs, see the description of the appropriate project item or simply click within the log page and press F1. |
Resolving Errors
Your test may fail. There can be several possible reasons for this. For instance, developers could change the application behavior, the recognition attributes of windows and control change and make the test engine fail to find the needed objects, a third-party application may overlap windows of your application and make the test engine fail to simulate actions on them, and so on.
One of the most typical reasons that novice users face is the difference in the application state during the test creation and playback. To avoid this problem, make sure that the initial conditions of the test run correspond to those you had when creating the test. For instance, if the tested application had been running before you recorded the test, it also must be running before you run the test; if the tested web page was opened on the second tab of your web browser when you recorded your test, it should also be opened on the second tab when you run the test, and so on.
For information on searching for the cause of errors and resolving typical problems, see Handling Playback Errors.
 Prev
Prev