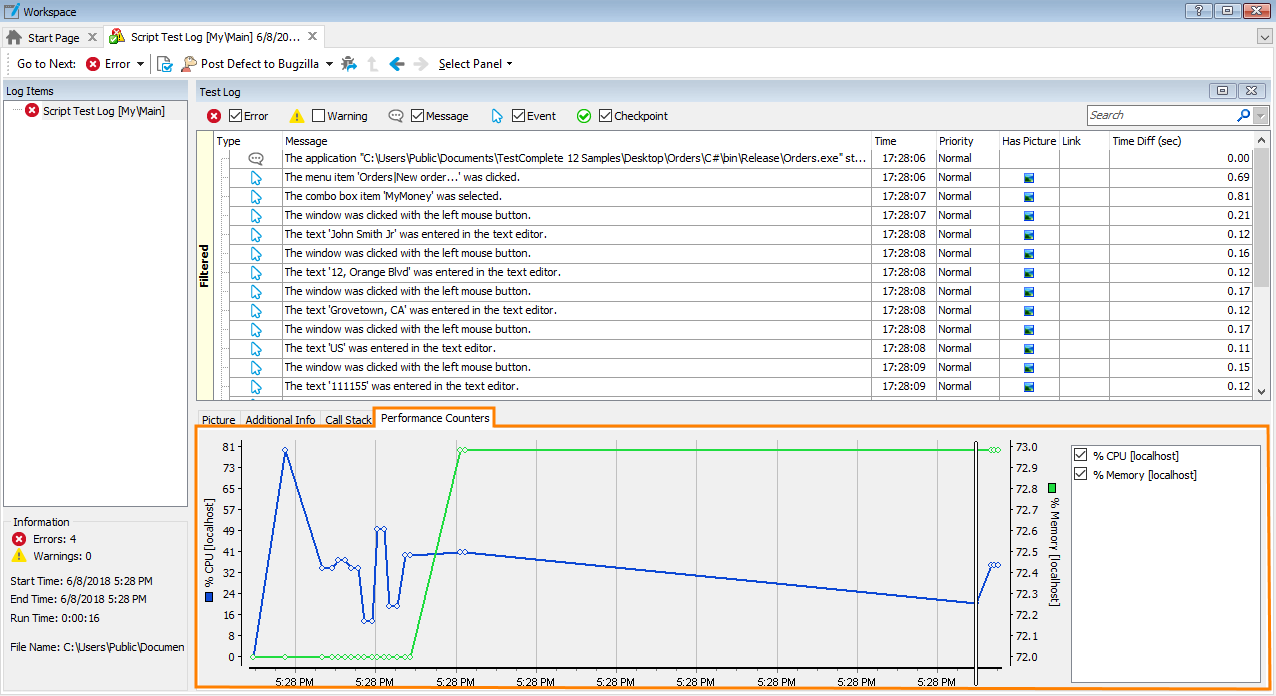
The Performance Counters panel of the generic test log page displays graphs of the performance counters monitored during the test run. The counter values are captured each time a new entry is posted to the test log, rather than at fixed time intervals.
To add more counters to the graph
-
Select Tools | Current Project Properties from the TestComplete main menu.
-
Switch to the Performance Counters category.
-
Click Add in the ensuing Performance Counters dialog.
-
Follow the instructions of the Add Counter wizard and click Finish when the desired counter is configured.
-
Rerun your test and switch to the Performance Counters panel. Now, it contains graphs for the added counters.
To show or hide the legend
-
Right-click somewhere withing the graph.
-
Select Show Legend from the context menu.
To show or hide specific counters
To temporarily hide a specific counter in the graph, clear the check box on the left of the counter name shown in the graph’s legend.
To show the graph in the Performance Counters panel, simply select the corresponding check box in the legend.
To zoom the graph in and out
-
Right-click somewhere withing the graph
-
Use the Zoom In, Zoom Out or Zoom Default items of the context menu.
For more information on monitoring performance counters with TestComplete, see Monitoring Tested Application Performance.
See Also
Generic Test Log - Test Log Panel
Adding Performance Counters
Counter Reference

