About Panels
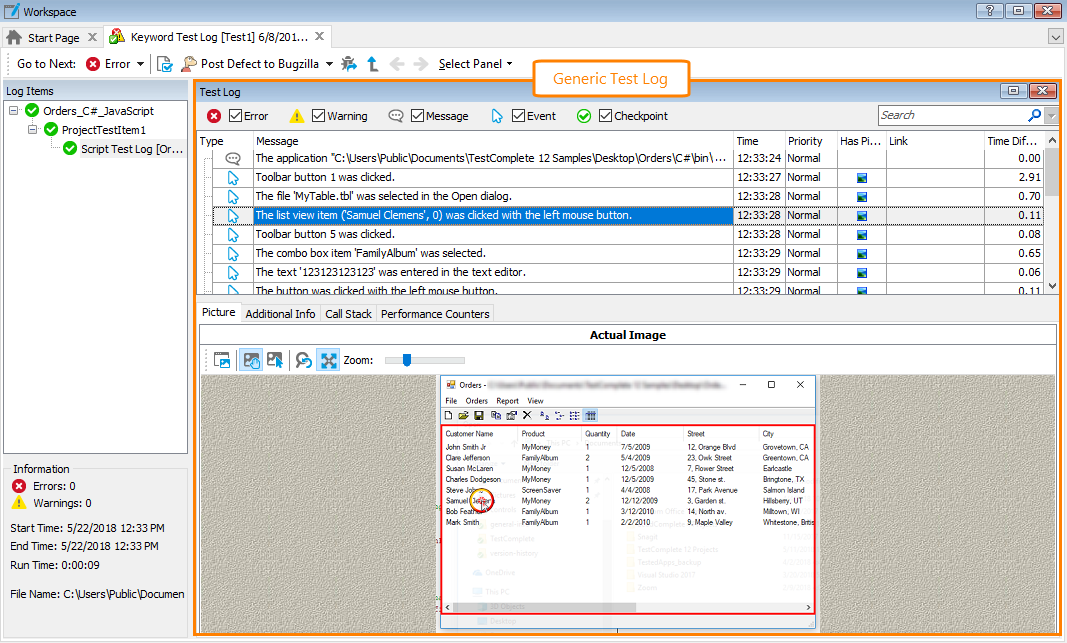
Each of TestComplete project items use specific log pages. The Generic Test Log page is common for many tests: keyword tests, script routines, TestComplete unit tests and some others. The page uses the following panels:
- Test Log
- Picture
- Additional Info
- Call Stack
- Performance Counters
| Panel | Description |
|---|---|
|
Contains messages posted to the log by TestComplete or your test (by operations of your keyword test, statement of script code and so on). |
|
|
Displays an image or images associated with the message which is selected in the Test Log panel. |
|
|
Contains additional information for the message. |
|
|
Displays the execution sequence of tests that led to the execution of the test in which the message was posted. |
|
|
Displays the evolution of performance counters monitored during the test run. |
Common Tasks
Below is a description of some operations that are performed most frequently on the generic test log.
To view extended information or images associated with a message
-
Select the desired message in the Test Log panel. TestComplete will update other log panels with the information relevant for the selected messages.
-
Switch to the Additional Info or Picture panel to view the extended information or image.
To jump to the keyword test operation or script code that posted a message
To view a keyword test operation or script code that posted a message to the log, simply double-click the desired message in the Test Log panel. TestComplete will open the test or script unit for editing and highlight the operation or line in it.
| Note: | You cannot jump to the script code, if the computer where the test was run does not have the script debugger installed (see Debugging Tests - Overview). |
To view a call stack for a message
Typically, tests may call each other. For example, a keyword test may call a script routine and vice versa. The execution sequence may be even more complex and include several levels. Knowing this sequence may help you better understand what happened in your project during the run and find the cause of the problem.
To view the run sequence of tests that led to posting a message to the log:
-
Select the desired message in the Test Log panel.
-
Switch to the Call Stack panel. This panel lists the execution sequence of tests that led to posting the selected message to the log.
You can then open the tests for editing by double-clicking the desired test in the Call Stack panel.
| Note: | The Call Stack panel is empty, if the test engine did not collect the data about the test execution sequence during the run. For information about collecting this data, see Collecting Call Stack Information for Log Messages. |
To filter messages by their type
To view or hide error, warning, informative and other messages in the test log, simply select or clear the check boxes at the top of the Test Log panel. This will filter the log contents so that the panel displays messages of the selected type. For instance, by selecting the Error check box and clearing other check boxes, you can command the panel to only display the error messages:
To filter messages by their contents
To view the messages that contain specific words or phrase, type the desired words into the Quick Search edit box (it is shown at the top-right corner of the panel):

The panel will display only those rows that contain all typed words.
Notes:
- The search is case-insensitive.
- The search is performed in all visible columns.
- The search is only performed in the rows that are visible in the panel. For instance, if the Event messages are filtered out and hidden because the Event check box is clear (see above), the search will not be performed in them.
To remove the filter, erase the text you have typed, or just click the  button (it appears if the Quick Search box has text).
To update a Visualizer frame from the test log
You can update a Visualizer frame directly from the test log. To do this, follow the steps below:
- Select the desired log item in the Test Log panel.
- Select the line that contains the image to be updated (when you select lines in the test log, Visualizer images that correspond to these lines are shown in the Picture panel)
- Switch to the Picture panel.
As you can see, the Picture panel contains two images: the expected and actual ones.Note: A Visualizer frame can be updated with the actual image only. - Right-click the image shown in the Actual Image section and select Update Visualizer Data from the ensuing context menu.
 |
If you use this item to update the Visualizer frame that contains test object info, all the information about the controls that are shown on the image will be lost. |
To update a checkpoint from the test log
-
Select the message informing about the checkpoint failure in the test log.
-
Switch to the Additional Info panel.
-
Click the Update the <Checkpoint_name> checkpoint link at the bottom of the panel.
-
TestComplete will display a message asking you want to update the checkpoint. Click Yes in this message to close it and to update the baseline data used for the failed checkpoint. After that, TestComplete will replace the stored item with the actual data. If you click No, TestComplete will close the message without updating the checkpoint.
For more information on updating checkpoints, see the description of the desired checkpoint type.
See Also
About Test Log
Posting Messages to the Log
Posting Messages, Images and Files to the Log


