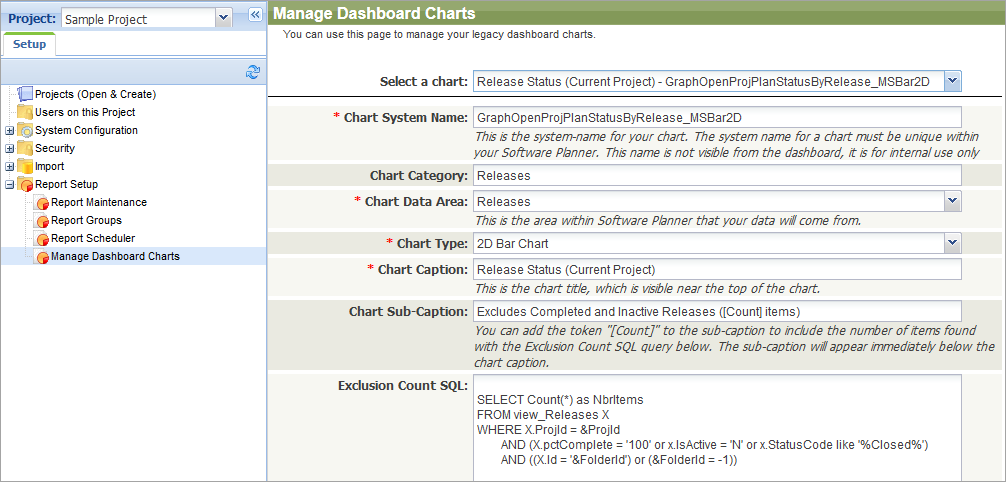
If you have the On-Premises edition of QAComplete, you can modify existing dashboard charts and create custom ones. To do this, click > Setup and then select Report Setup > Manage Dashboard Charts in the navigation panel on the left:
Select the chart you want to modify in the Select a chart drop-down list or create a new chart. For a chart, you can specify the following values:
-
Chart System Name – For internal use. A chart’s unique name.
-
Chart Category – Specify the category to which the chart will belong in Home > Dashboards.
-
Chart Data Area – Select the QAComplete item type (defects, requirements, and so on), data for which the chart will be shown.
-
Chart Type – Select the chart type: 3D Pie Chart, Line Chart, 2D Bar Chart, and so on.
-
Chart Caption – The chart caption. You can view it at the top of the chart.
-
Chart Sub-Caption – The chart sub-caption. You can view it under the chart caption. With the
[Count]token, you can add the number of items to the sub-caption. This number will be parsed from the SQL query that will count the excluded data. -
Exclusion Count SQL – When specifying chart data, you may want to exclude items (for example, inactive items). To show how many items are not included into the chart, specify the SQL query that will count the excluded data.
-
Chart Data SQL – Specify the SQL query that will retrieve the data that the chart will show.
-
Drill Down Report SQL – You can click the chart elements to view detailed information on chart data. Specify the SQL query that will retrieve the data the chart will show upon clicking it.
-
Chart Data Connection String – Enter the connection string to connect to the database from which the chart will retrieve data. To retrieve data from the QAComplete database, leave the default
LOCALvalue. To create a chart that shows data retrieved from an external database, enter the connection string to that database. -
Drop Down SQL – Charts can have a drop-down list (for example, the one with filters, folder selection, and so on). Specify the SQL query to retrieve the items these drop-down lists will show.
-
Colors – Specify the list of colors (comma-delimited, hex format) that the report will use to show data. Make sure you specify enough colors for the data your report will show.
-
Chart Behaviors – Specify how the Dashboards screen renders the chart. For example, you can specify the chart size.
-
Chart Attributes – The XML string that sets the chart background colors and other attributes.
Tip: This feature is available for legacy charts only. -
Link Template – Use this to set up your chart to drill-down into QAComplete pages.
-
Chart Security Entity – Specify the security entity that controls access to the chart.
-
Chart Project Visibility – Select whether the chart is available to all projects or only to the current project.
-
Is Active – Specify whether the chart is active.
-
Is Public – Specify whether the chart is available to all users.
Click Preview Chart to view the chart before creating it. Click Submit to create the chart. The created chart will become available on the Dashboards page.

