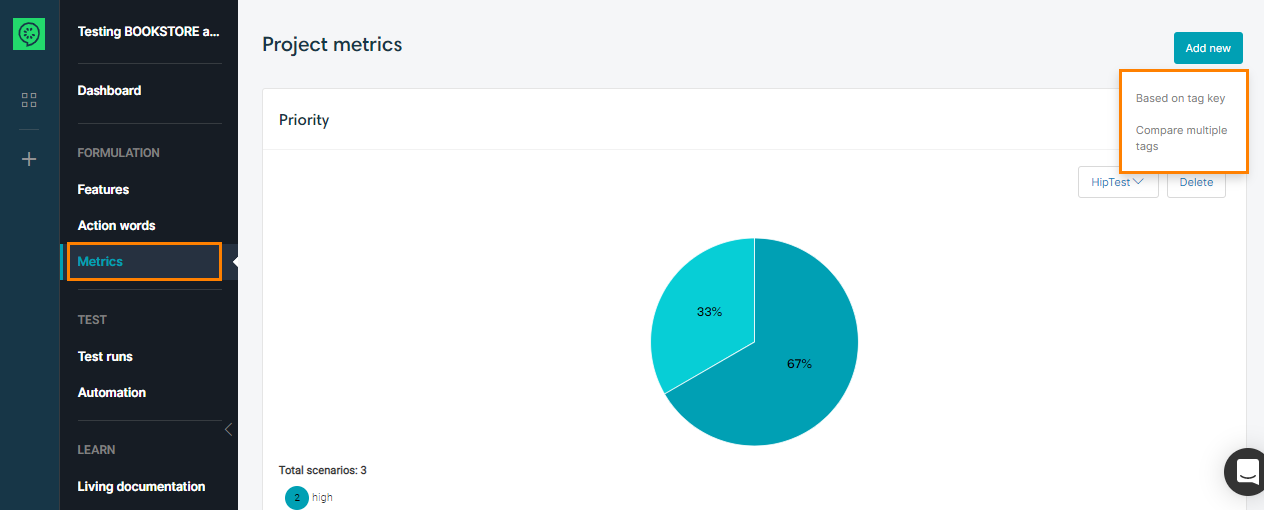
The metrics panel inside a CucumberStudio project gives you the possibility to generate various types of metrics about your project. From the “Metrics” section of the left menu, simply click on the Add new button and select the type of metrics you want to create.
Those metrics show the current status of your project, so every time you open the page, the charts will be generated with the live data.
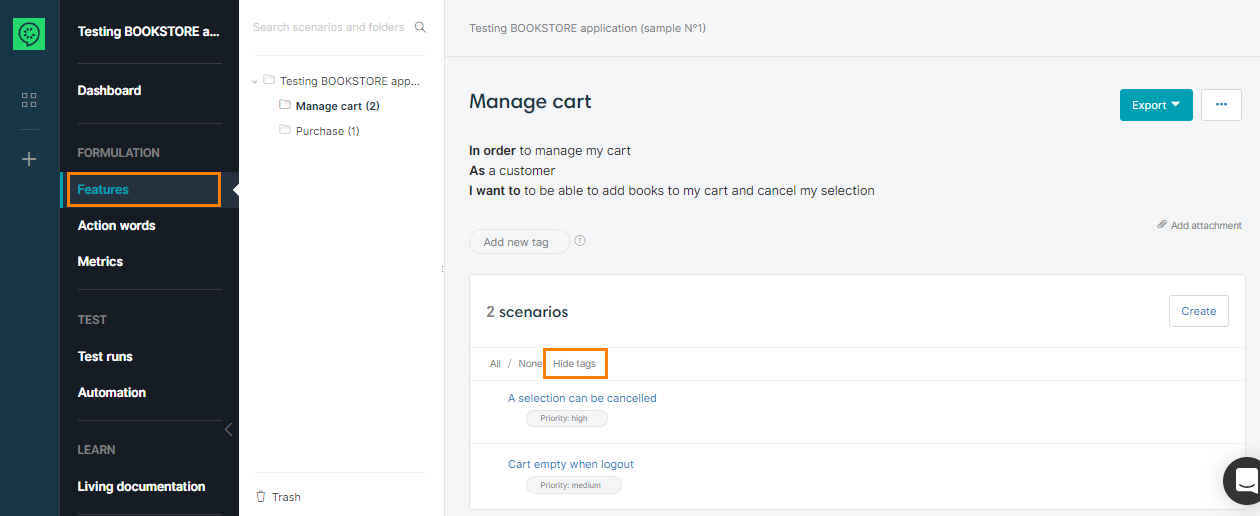
Let’s consider these scenarios:
| Note: | You can show or hide the tags using the “Show/Hide tags” button. |
We’ll now explain each metrics type you can create.
Based on Tag Key
This metrics type is based on the tags you set up on the scenarios of your project. It only takes into account the key/value tags (for example “priority: high”).
After choosing the tag key you want to take into account, a pie-chart is generated according to the number of scenarios associated with the tag values classification.
Here is an example of a pie-chart based on the “priority” tag key:
As we can see in the chart, we have three scenarios having a priority set to low, four scenarios having a priority set to medium and seven scenarios having the priority high.
Compare Multiple Tags
As the previous metric type, this pie-chart is based on the tags that have been set on the scenarios. However, in this one you can select multiple tags (the tags values are not taken into account) and compare the number of scenarios linked to each one.
For example, tags keys set on the scenarios are “todo”, “wip” and “in-production”, if we create a metric comparing the use of theses tags, we would obtain the following pie-chart:
Here, we can see that two scenarios have a tag “wip”, one has a tag “todo” and two have the tag “in-production”.


