
The Details panel contains charts that graphically illustrates results displayed in this panel. Using the Customize Charts dialog you can modify properties of these charts. To display the dialog, select Customize Charts from the context menu of the Details panel. The contents of this dialog depends on the current profiler. If the current profiler is Performance, the dialog looks in the following way:
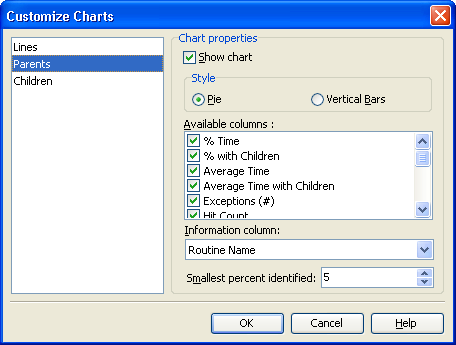
On the left of the dialog there is a list of all charts available in the Details panel. To modify properties of a chart, select it in the list and then modify values in the following controls:
- Show chart - This check box specifies whether the chart is visible or not.
- Style - Specifies the chart style: Pie or Vertical Bars.
- Available columns - The chart can display results stored in any numerical column of the table that is located on the right of the chart. To select what column value the chart should display, right-click the chart in the Details panel and then select the name of the desired column from the context menu. Using the Available columns box you can specify what column(s) will be shown in this context menu. To remove a column from the menu, uncheck it in the Available columns box. To show a column name in the menu, check the column in the Available columns box.
- Information column - When you move the mouse cursor over different sections of the chart, AQTime shows hints for these parts. The Information column box specifies the column, whose value will be displayed as hint.
- Smallest percent identified - If routine's (object's) result value displayed in the chart (for example, Hit Count) is less than the value specified by the Smallest percent identified box, AQTime leaves this routine (object) in the Other part of the chart.