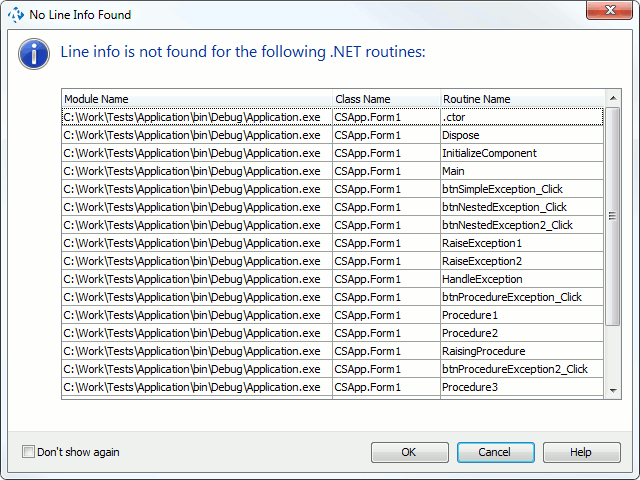
AQTime displays this dialog if it could not find debug information for some of the routines that are included for profiling at line level. Typically, this problem is caused by one of the following --
- You have compiled your application without debug information. In this case, AQTime will use metadata to get symbolic information about the managed code. Since the metadata contains no information about source code lines, these types of routines can only be profiled at routine level. To profile them at line level, compile the application with debug information.
- The routines listed in the dialog were generated by the compiler automatically. Some compilers, for example, Visual C++ or C#, can automatically generate routines for default constructors, default destructors, the "=" operator, etc. Since these routines are generated automatically, there is no source code for them and the debug info holds no information about source code lines for these routines. These routines can be profiled at routine level only.
AQTime displays this dialog for both managed and unmanaged routines. The following figure shows the dialog for managed code:

If you click OK, AQTime will ignore the listed routines and continue profiling. Pressing Cancel will cancel profiling. If you don't want to see this dialog in the future, enable the Don't show again flag or disable the Show No Line Info dialog option.
See Also
Profiling Levels
How AQTime Profilers Use Metadata and Debug Information
