This topic describes the actions you may need to perform in order to profile scripts with AQTime. These actions include:
1. Checking for Required Components
The script profiling feature requires that the Windows Script component be installed. Additionally, the Script Debugger can be required for profiling scripts in Internet Explorer ver. 7 and earlier.
The Windows Script component is supplied with each Microsoft operating system (since Windows 98), thus it is already present on your machine. The Script Debugger may also be installed on your machine, as it is shipped along with Visual Studio (since version 2003) and Microsoft Office (version XP and later).
If you have problems with profiling scripts, try reinstalling these components. You can find the standalone packages at Microsoft Download Center (http://www.microsoft.com/downloads). Just search for the following items:
-
Windows Script (Windows Script 5.6 or later is required)
-
Script Debugger
The versions of Windows Script and Script Debugger may be different and incompatible with one another. For information on possible problems and workaround for them, see Profiling Scripts - Troubleshooting.
2. Setting User Permissions
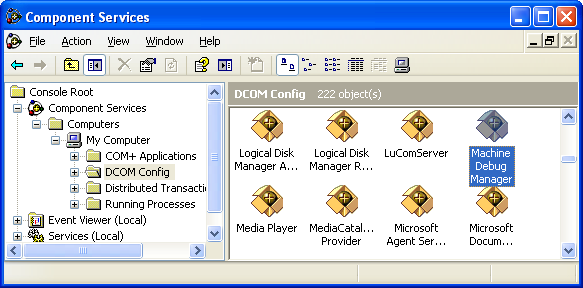
In order to debug script code, your user account must have the Launch and Activation and Access permissions for the Machine Debug Manager system component. By default, these permissions are granted to user accounts that belong to the Administrators and Debugger Users groups. To obtain the permissions, ask your administrator to add your account to these groups. An alternative way is to ask your administrator to modify permissions for the Machine Debug Manager component.
You can change the permissions using the Component Services snap-in:
-
The way you open the snap-in depends on your operating system:
-
On Windows Vista or later:
-
Click Start and type dcomcnfg in the search box.
-
Click dcomcnfg.exe in the search results.
-
-
On Windows XP or Windows Server 2003:
-
Click Start and click Run.
-
In the Run dialog, type dcomcnfg and press Enter.
-
Now the Component Services snap-in is available for configuring.
-
-
Select the Console Root > Component Services > Computers > My Computer > DCOM Config node in the tree on the left of the window.

-
Right-click Machine Debug Manager in the list of available components and choose Properties from the context menu.
-
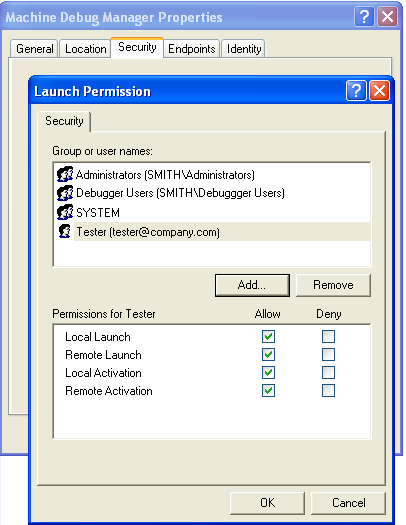
Switch to the Security tabbed page of the subsequent dialog.
-
Choose Customize in the Launch and Activation Permissions group and press Edit.
-
Select your user account in the ensuing dialog, enable the Allow checkmark at least for the Local Launch and Local Activation items and press OK to close the dialog.

-
Choose Customize in the Access Permissions group and press Edit.
-
Select your user account in the ensuing dialog, enable the Allow checkmark at least for the Local Access item and press OK to close the dialog.
-
Press OK in the Machine Debug Manager Properties dialog to close it and save the changes.
3. Preparing the Host Application for Script Profiling
AQTime gathers data about scripting activity from the Microsoft Scripting Engine. It tracks the debug information that is passed to the engine. Therefore, in order to obtain profiling results in AQTime, the following conditions should be met:
-
The host application should generate debug information
-
The debug information should be handled by the Microsoft Scripting Engine
The settings that allow meeting these conditions depend on a particular host application. The settings for frequently used script hosts are described below.
3.1 Preparing Internet Explorer
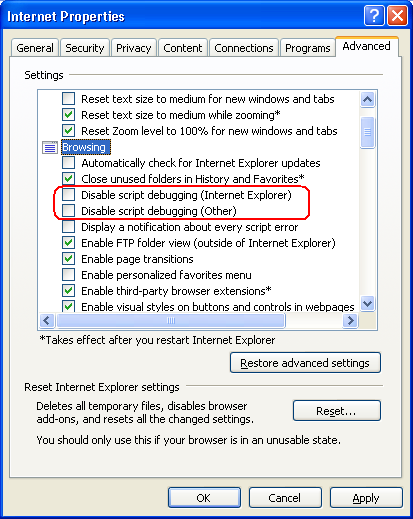
To intercept the scripting activity from Internet Explorer, you should enable the browser’s script debugger:
-
Open the Control panel.
-
Select Internet Options.
-
Switch to the Advanced page of the ensuing Internet Options dialog.
-
Clear the Disable Script Debugging (Internet Explorer) and Disable Script Debugging (Other) check boxes in the Browsing category.

-
Click OK to save the changes and close the dialog.
(Optional) Disabling Multiple Processes of Internet Explorer
Starting from version 8, Internet Explorer includes the Loosely-Coupled Internet Explorer (LCIE) feature that makes the Internet Explorer window and all tabs run in separate processes. AQTime can automatically detect the browser process that hosts the target script code and profile it.
However, in several cases you may want to improve the profiling performance by disabling the multiple-process mode in Internet Explorer (for more information, see Profiling Browser-Hosted Code). To disable LCIE in Internet Explorer, follow the steps below:
-
Click Start and select Run. In the Run dialog box, type regedit and press ENTER. This will open the Registry Editor.
-
In the registry, locate the following key:
HKEY_CURRENT_USER\Software\Microsoft\Internet Explorer\Main
-
In this key, find the TabProcGrowth value.
If the value does not exist, create a new DWORD (32-bit) value and name it TabProcGrowth.
-
Set it to 0.
-
Close the Registry Editor.
| Note: | For information on how AQTime detects the target web process depending on whether the browser is running in the single-process mode or in the multiple-process mode, see the description of the Consider the browser to be a single process property. |
3.2 Preparing Windows Script Host
Windows Script Host allows you to run scripts directly from Microsoft Windows. It is represented by two executables: WScript and CScript. They operate in a similar way, the only difference is that WScript generates windowed output, while CScript sends its output to a console. The scripts to be launched, as well as host options and script parameters, are passed to Windows Script Host via command-line arguments.
To obtain profiling results from Windows Script Host, you should enable its built-in debugger and send the script’s output to the console. This behavior is controlled by the //D and //H:CScript host options respectively. That is, to get profiling results in AQTime, you should use the following syntax: WScript.exe or CScript.exe//D //H:CScript Other_Host_Options "Path_To_Script" Script_Parameters. For example, WScript.exe //D //H:CScript "C:\Work\MyScript.js".
See Also
Profiling Scripts
Profiling Scripts - Overview
Profiling Scripts - Troubleshooting
Profiling Scripts in Internet Explorer 8 and Later

 1. Checking for Required Components