For the most comprehensive profiling results, it is recommended that you compile your F# application with debug information (see How AQTime Profilers Use Metadata and Debug Information). The way you do this depends on whether you compile your application from the command line or from Microsoft Visual Studio.
F# Compiler (fsc.exe)
When using command line compilation, you can generate debug information for your F# application by compiling it with either the -g, -g+, --debug or --debug+ option and without the --optimize (or -O) option.
For more information about F# compiler command line options, see fsc -? or refer to the Compiler Options (F#) article in the MSDN library (the online version is available at http://msdn.microsoft.com).
Microsoft Visual Studio
If you use Microsoft Visual Studio 2008, 2010, 2012, 2013, 2015 or 2017 with Microsoft Visual F#, follow these steps to add debug information to your F# application:
-
Open your F# project in Microsoft Visual Studio.
-
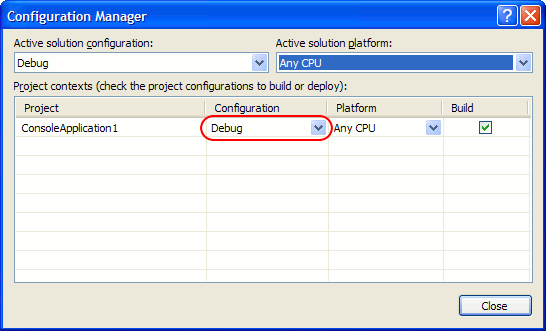
Select Build > Configuration Manager from the main menu of Visual Studio. The Configuration Manager dialog will open.
-
Select the Debug configuration and close the dialog:
-
Right-click the project in the Solution Explorer and select Properties from the context menu. The Property Designer will open.
-
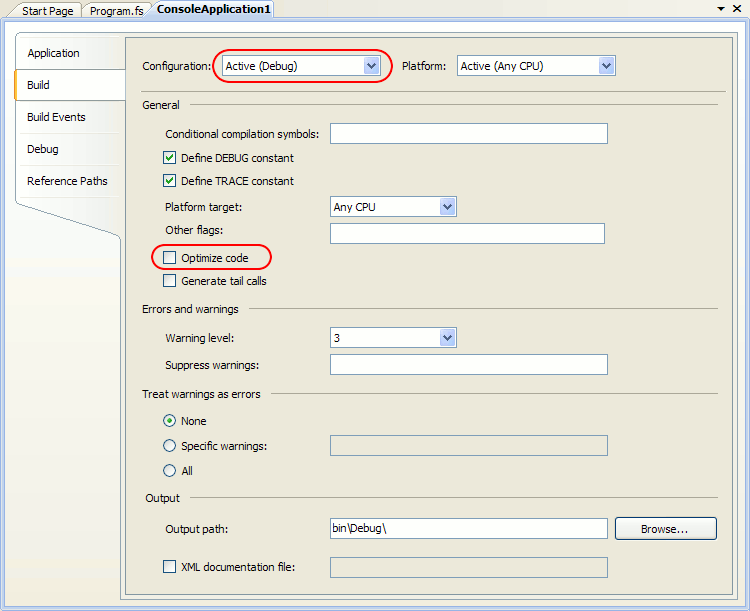
Select the Build property page.
-
Select Active (Debug) from the Configuration drop-down list at the top of the dialog.
-
Clear the Optimize code check box.
-
Save the changes made to the project.
-
Recompile your application.
When your application is ready for the final delivery, remember to recompile it in the Release configuration and without debug information to reduce the overall application size.
See Also
Preparing Applications for Profiling
How AQTime Profilers Use Metadata and Debug Information
Compiler Settings for .NET Applications

 F# Compiler (fsc.exe)
