This topic explains how to prepare applications created with Microsoft Visual C++ 2005 - 2015 for AQTime. To learn how to prepare applications created with other compilers, see the topics below:
Note that default settings created by Microsoft Visual Studio for a new Visual C++ application already contain the necessary information for generating debug information. So, if you do not change the compiler settings, you can compile and profile your Visual C++ application as is. However, we recommend that you change the active configuration to Release if you are going to profile with the Performance profiler. The Release configuration is used to build the final version of the application, so you should search for performance bottlenecks in versions compiled with the Release configuration, but not with the Debug configuration.
If you are not sure whether your application's compiler settings were changed, you can follow the steps described in this topic to make sure that your application is compiled with debug information.
To add debug information to your Visual C++ 2005 - 2015 application, follow these steps:
- Open your project in Visual Studio.
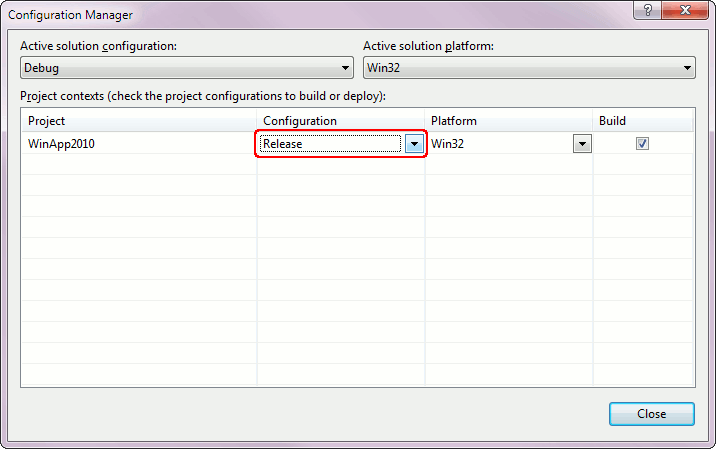
- Select Build > Configuration Manager from the main menu. This will open the Configuration Manager dialog. Select the Release configuration for your project:
Close the dialog.
Note: Of course, you can profile your application in any configuration, not just in the Release one. We recommend that you choose this configuration if you are going to use the Performance profiler (see above). - Right-click the project in the Solution Explorer and select Properties from the context menu. This will call the Property Pages dialog.
- In the dialog,
- Select Active (Release) from the Configuration dropdown list.
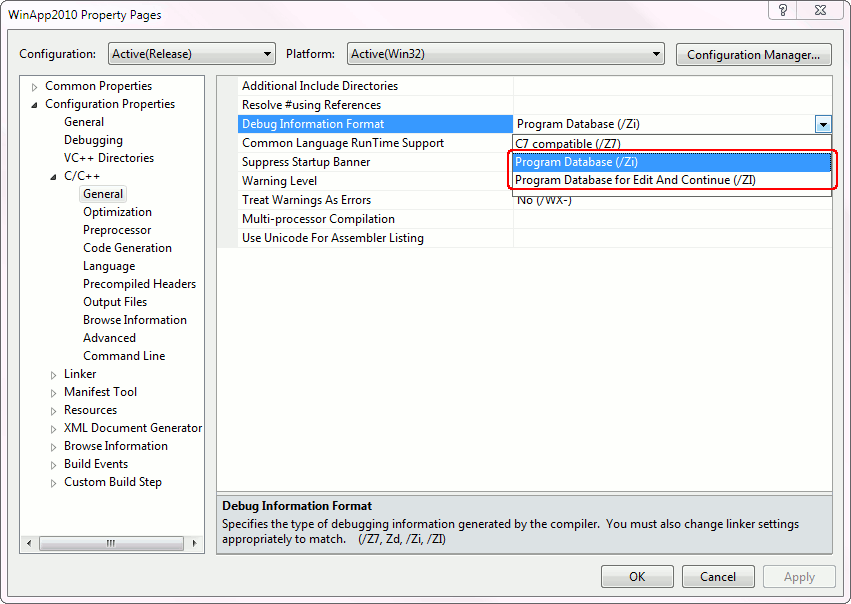
- Switch to the Configuration Properties > C/C++ > General page and set Debug Information Format to Program Database (/Zi) or Program Database for Edit & Continue (/ZI). For more information on these options review the Visual Studio documentation.
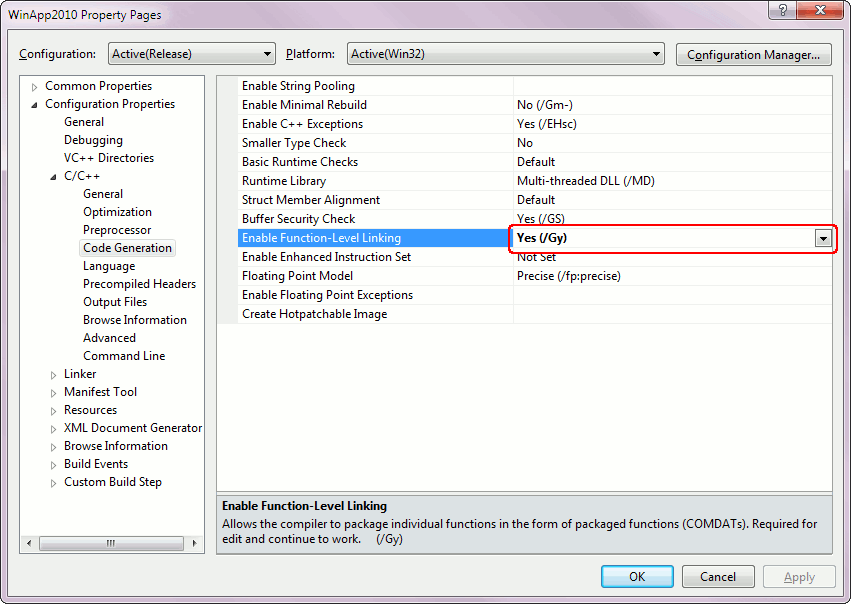
- Open the Configuration Properties > C/C++ > Code Generation property page and set the Enable Function-Level Linking option to Yes (/Gy).
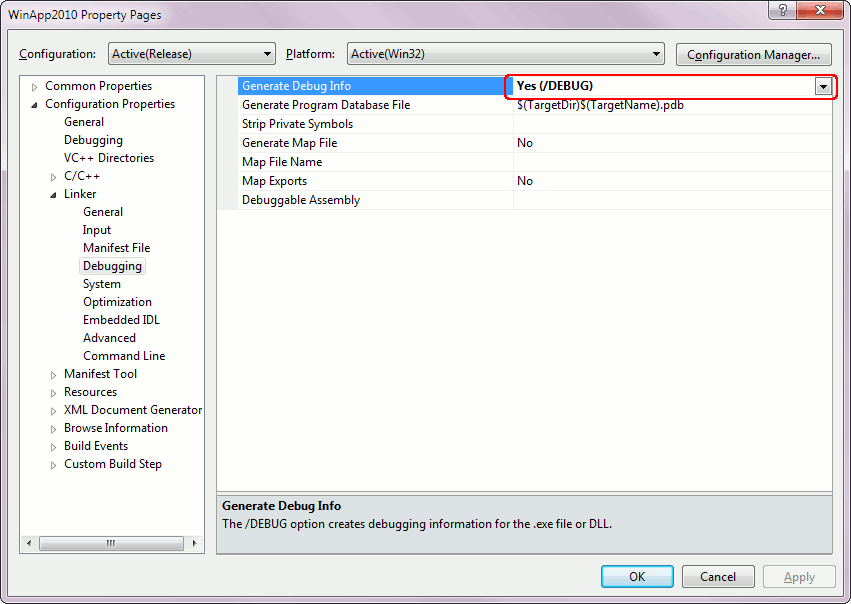
- Open the Configuration Properties > Linker > Debugging property page and set the Generate Debug Info option to Yes (/DEBUG).
- Click OK to save the settings and then rebuild the application. Once finished, your application will be ready for profiling in AQTime.
Before opening the application in AQTime, make sure that the output directory of your application includes the .pdb file that you have created. In addition, this directory should contain the vcX0.pdb file, where X is the major version number of the Visual C++ compiler, e.g. for Visual C++ 8.0 this file is called vc80.pdb. vcX0.pdb contains part of your application's debugging information, which may be needed to profile the entire application in AQTime correctly. It is possible that the vc80.pdb file is not generated by Visual Studio and this will not cause any problems with profiling. If you are profiling an ActiveX control or a COM server, do not forget to register its "debug" version in the system (See Profiling COM Applications).
By default, the .pdb debug info file resides in the same folder where the profiled executable or DLL is located. When you open your module in AQTime, it searches for the debug info file in this default location. If you copy the debug info file to another location, then specify this location in the Symbols Path list of the Symbols Options dialog (this list contains the search paths). See Specifying Path to Debug Info Files for more information.
When your application is ready for final delivery, remember to compile it without debug information to reduce the overall size of the application.
See Also
How AQTime Profilers Use Metadata and Debug Information
Profiling .NET Applications - Specifics


