About Performance Monitoring
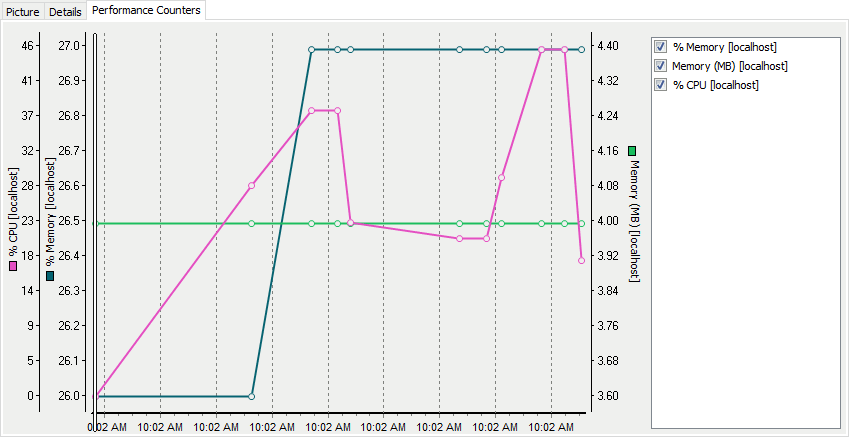
TestComplete can track various performance metrics of your tested application or your test environment, such as CPU load, memory and disk usage, the number of errors and so on, in real time during the test run. These metrics are displayed as graphs on the Performance Counters page of the test results after the test run has completed. The metric values are captured each time an entry is posted to the test log (rather than at regular intervals), so that you can correlate these values with specific test actions.

We use the term counters to refer to the monitored performance metrics. TestComplete can read counter values from applications and computers (Windows and Unix computers, Apache web servers).
You typically monitor the tested application’s performance counters during each test run (we call these counters application-specific). You can use the captured metric values to find performance bottlenecks in the tested application. Since the points on the graph correspond to individual operations performed by the test, you can determine the exact actions performed in the application during which bottlenecks were revealed. This information can help the application developers narrow down and fix the issue.
Supported Counters
TestComplete can capture performance counters from the local computer and from remote computers. However, the list of available counters is different for the local and remote computers. For example, if you are going to monitor the local computer on which TestComplete is running, you will be able to monitor predefined counters (CPU, memory and disk usage) and Windows performance counters (see below). The remote machines allow monitoring predefined, Windows, Unix or Apache server performance counters, depending on the tested computer.
-
Windows provides wide access to its resource monitors, and allows you to monitor the CPU, memory, disk and network load during the test execution. You can also monitor the performance of .NET-based applications using the .NET performance counters. For more information about resource counters available for the Windows OS, see the Windows Performance Counters topic.
-
UNIX-based OSes also provide counters for the CPU, disk, memory and network load. However, these methods are not as robust as those for Windows. For more information about resource counters available for these OSes, see the Unix Performance Counters topic.
-
Apache servers provide information on resource usage, such as the percentage of the machine CPU used for processing requests, as well as the information on server load, such as the number of requests per second. For more information about resource counters available for Apache servers, see the Apache Server Performance Counters topic.
 |
In order for TestComplete to be able to monitor performance counters on a remote machine, performance monitoring must be enabled on this machine in advance. For detailed instructions, see Enabling Performance Monitoring. |
Adding, Modifying and Deleting Counters
You can specify the performance counters to be monitored in the Performance Counters section of the project properties. TestComplete automatically adds the selected counters to the Performance Counters page after you run your test.
The approaches used to specify application-specific and computer-specific performance counters are slightly different. For more information on each approach, see Adding Performance Counters.
For detailed information on how to modify and exclude counters from monitoring, see the Modifying Performance Counters and Deleting Performance Counters help topics.
See Also
Monitoring Tested Application Performance
Generic Test Log - Performance Counters Panel
Enabling Performance Monitoring
Adding Performance Counters
